我希望能够对我的数据进行描述性统计,分为两类:1)“SampledSub”和“SampledLUL”,使用这里的一部分数据子集:
我已使用此代码将其分为两组进行汇总:
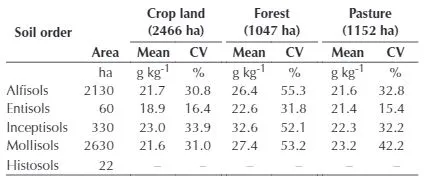
但输出表格包含组和摘要统计信息作为列。我该如何生成类似于下面所示的表格?在我的情况下,“Sampledsub”将是观察值,并且摘要统计信息将根据“SampledLUL”进行分组。
myData <- structure(list(SampledLUL = structure(c(12L, 12L, 9L, 9L, 9L,
9L), .Label = c("citrus", "crop", "cypress swamp", "freshwater marsh and wet prairie",
"hardwood swamp", "improved pasture", "mesic upland forest", "mixed wetland forest",
"pineland", "rangeland", "shrub swamp", "urban", "xeric upland forest"), class = "factor"),
SampledSub = structure(c(12L, 12L, 4L, 12L, 8L, 4L), .Label = c("Aqualf", "Aquent",
"Aquept", "Aquod", "Aquoll", "Aquult", "Arent", "Orthod", "Psamment", "Saprist", "Udalf",
"Udult"), class = "factor"), SOC = c(3.381524292, 6.345916406, 2.122765119, 2.188488973,
6.980834272, 7.363643479)),
.Names = c("SampledLUL", "SampledSub", "SOC"), row.names = c(NA, 6L), class = "data.frame")
我已使用此代码将其分为两组进行汇总:
group.test <- ddply(buffer, c("SampledSub", "SampledLUL"), summarise,
                   N    = length(SOC),
                   mean = mean(SOC),
                   sd   = sd(SOC),
                   se   = sd / sqrt(N) )
但输出表格包含组和摘要统计信息作为列。我该如何生成类似于下面所示的表格?在我的情况下,“Sampledsub”将是观察值,并且摘要统计信息将根据“SampledLUL”进行分组。
library(tables)中查看?tabular。 - akrunR 3.2.0+上无法使用。 - Pierre Ldput做得很棒! - jeremycg