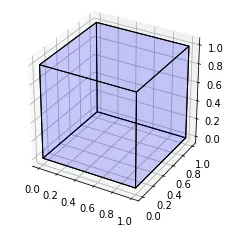
我正在尝试绘制一个长方体。实际上,我是从绘制立方体的Python脚本开始的:
import numpy as np
from mpl_toolkits.mplot3d import Axes3D
import matplotlib.pyplot as plt

points = np.array([[-1, -1, -1],
                  [1, -1, -1 ],
                  [1, 1, -1],
                  [-1, 1, -1],
                  [-1, -1, 1],
                  [1, -1, 1 ],
                  [1, 1, 1],
                  [-1, 1, 1]])


fig = plt.figure()
ax = fig.add_subplot(111, projection='3d')

r = [-1,1]

X, Y = np.meshgrid(r, r)

ax.plot_surface(X,Y,1, alpha=0.5)
ax.plot_surface(X,Y,-1, alpha=0.5)
ax.plot_surface(X,-1,Y, alpha=0.5)
ax.plot_surface(X,1,Y, alpha=0.5)
ax.plot_surface(1,X,Y, alpha=0.5)
ax.plot_surface(-1,X,Y, alpha=0.5)

ax.scatter3D(points[:, 0], points[:, 1], points[:, 2])

ax.set_xlabel('X')
ax.set_ylabel('Y')
ax.set_zlabel('Z')

plt.show()
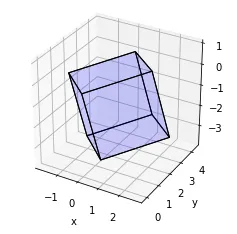
为了获得一个长方体,我将点矩阵乘以以下矩阵:
P =

[[2.06498904e-01  -6.30755443e-07   1.07477548e-03]

 [1.61535574e-06   1.18897198e-01   7.85307721e-06]

 [7.08353661e-02   4.48415767e-06   2.05395893e-01]]
如下:
Z = np.zeros((8,3))

for i in range(8):

   Z[i,:] = np.dot(points[i,:],P)

Z = 10.0*Z
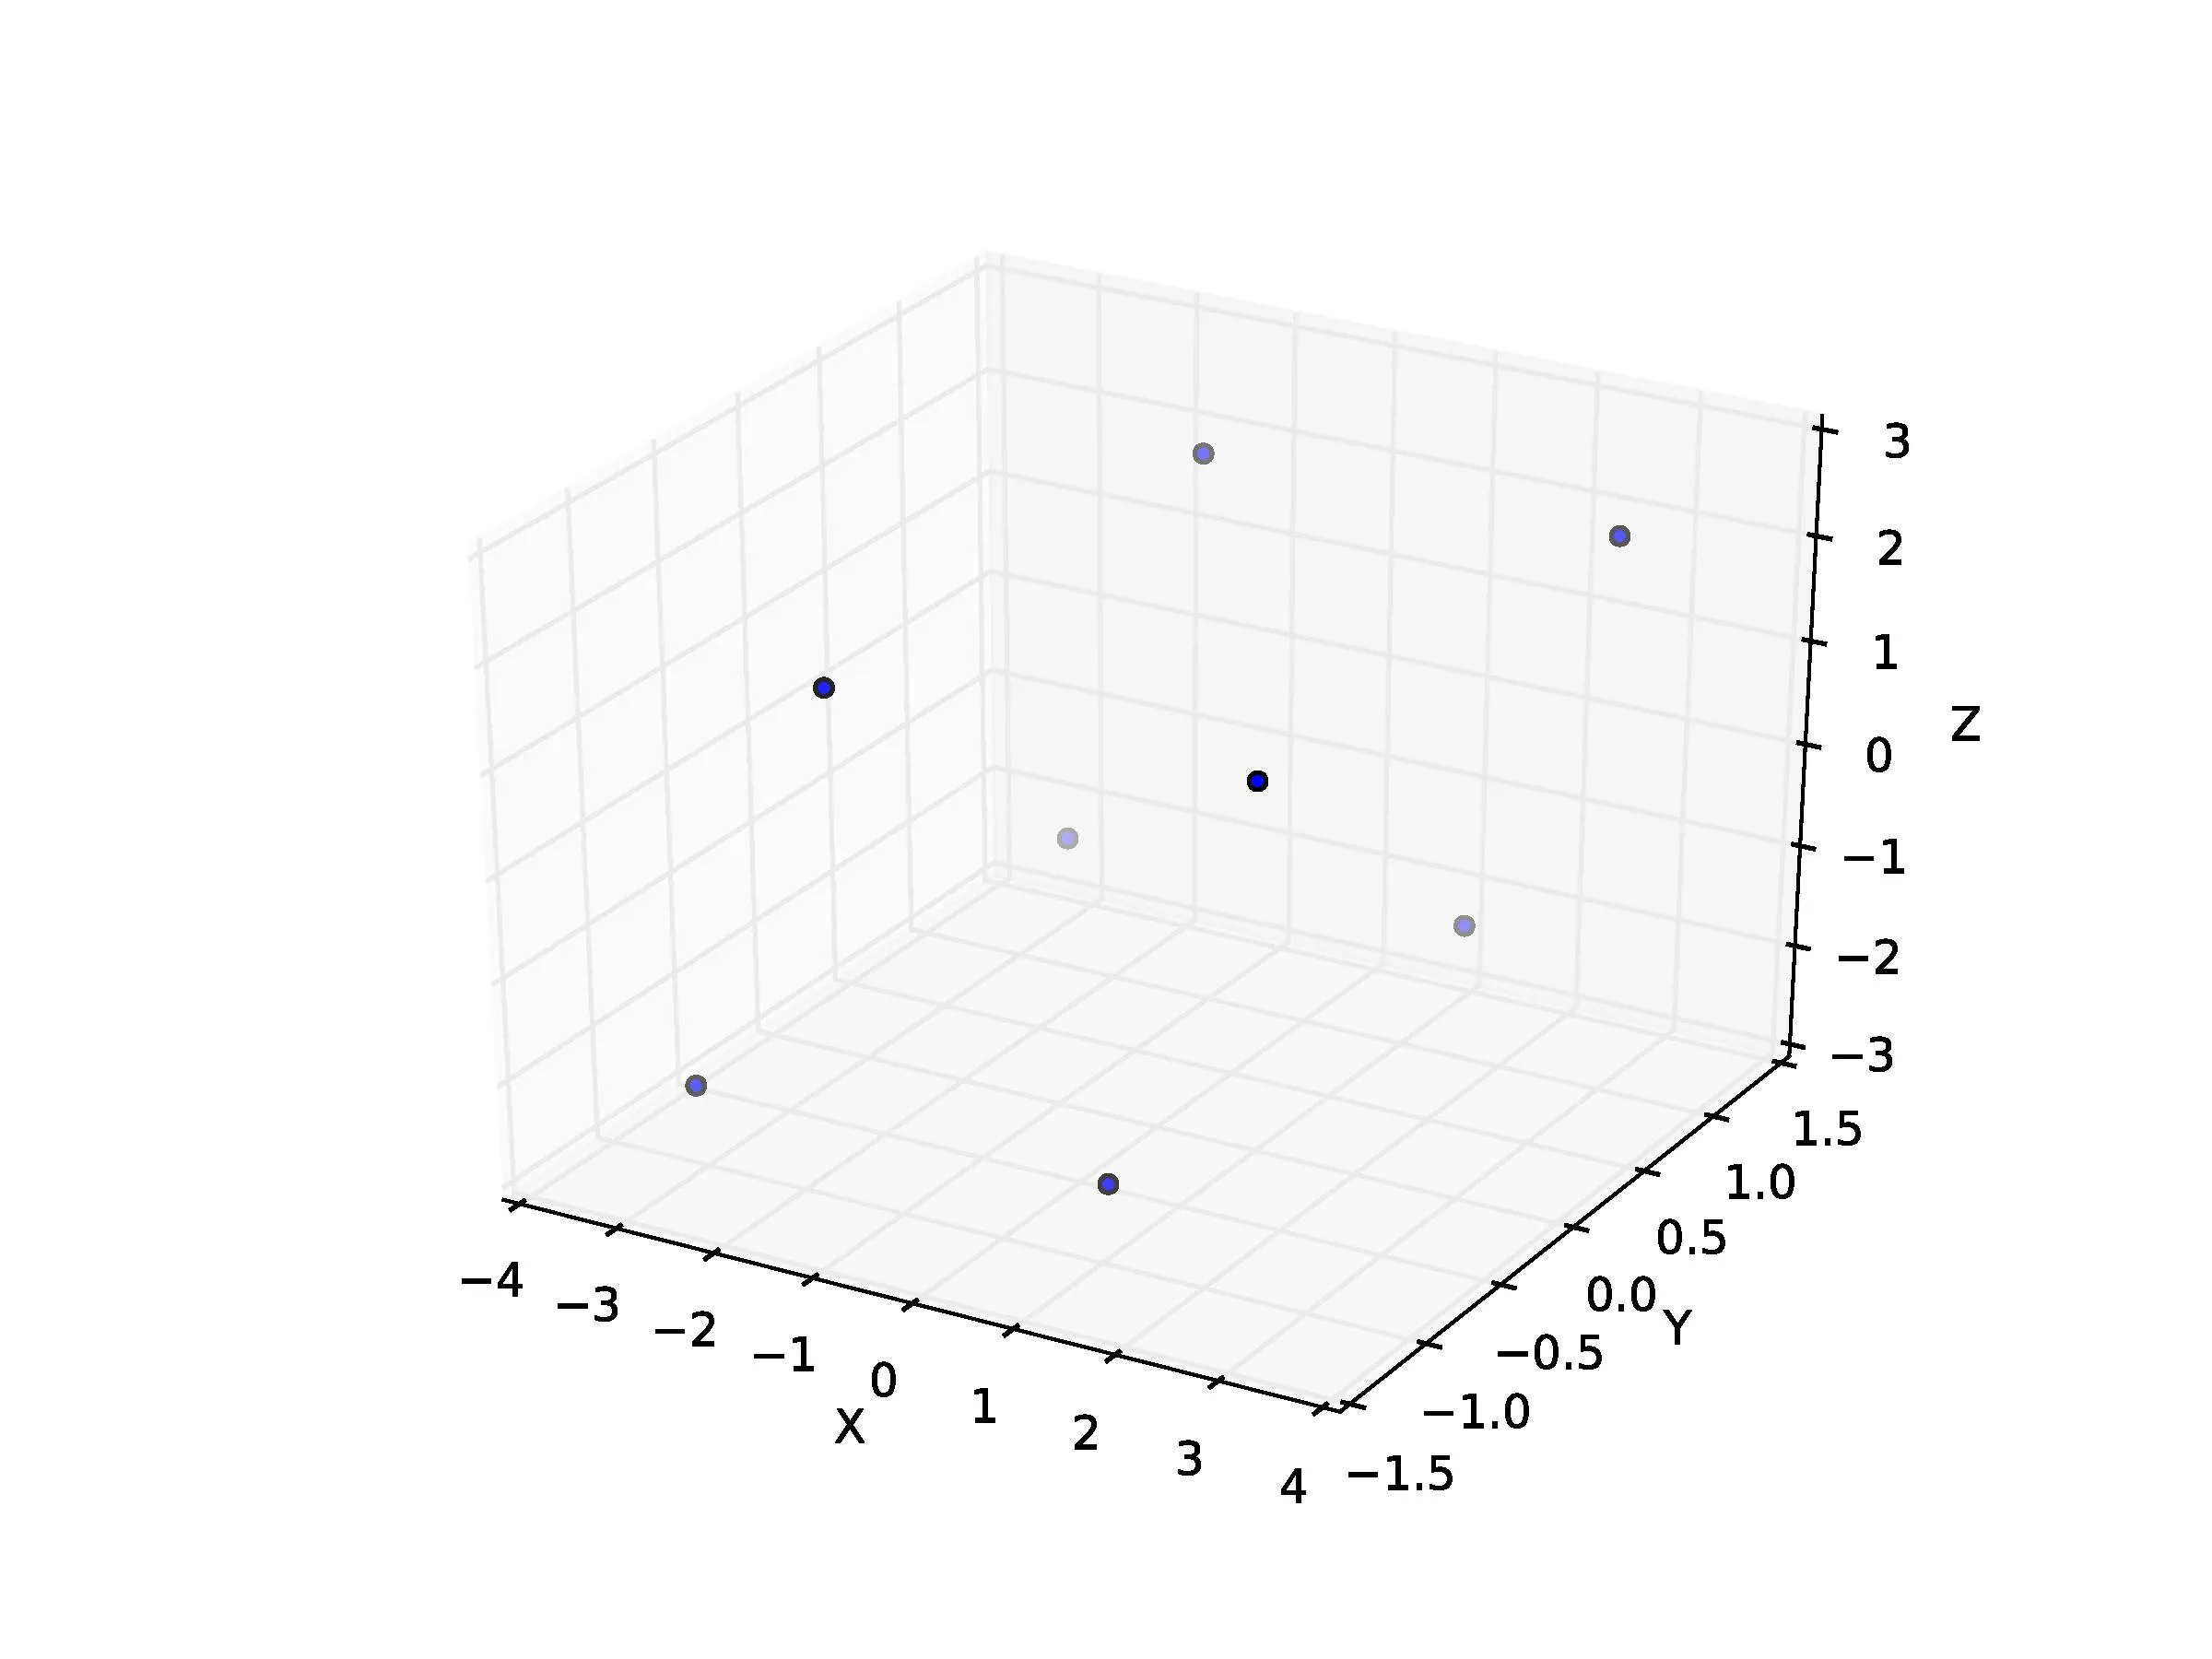
我的想法是这样表示的:
ax.scatter3D(Z[:, 0], Z[:, 1], Z[:, 2])

ax.set_xlabel('X')
ax.set_ylabel('Y')
ax.set_zlabel('Z')

plt.show()
这就是我得到的:
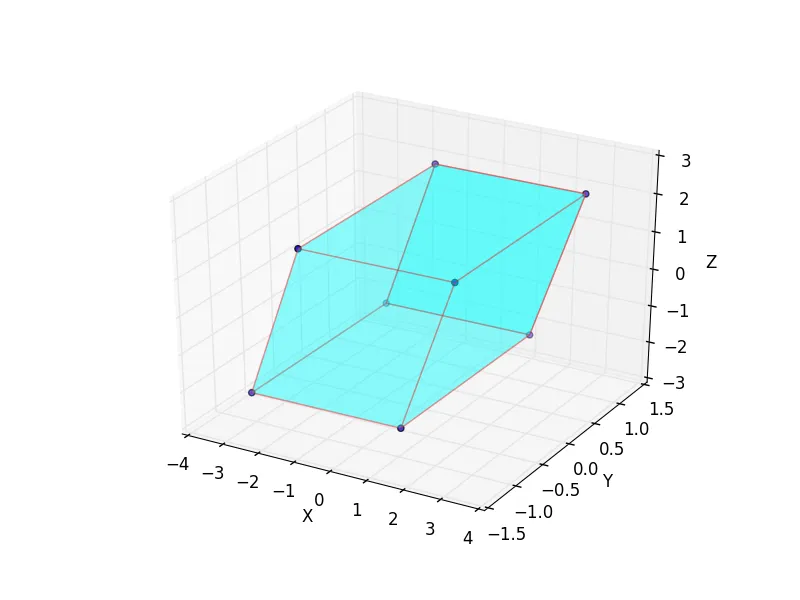
我该如何在这些不同的点上放置表面以形成平行六面体(像上面的立方体一样)?