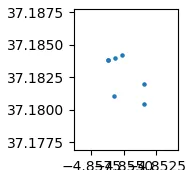
如何绘制一个Shapely点列表

7
我根据点数据集创建了一个Shapely Point对象列表。如何在下面绘制这个点列表?
points = [Point(-4.85624511894443, 37.1837967179202), 
          Point(-4.855703975302475, 37.18401757756585),
          Point(-4.85516283166052, 37.1842384372115),
          Point(-4.85343407576431, 37.182006629169),
          Point(-4.85347524651836, 37.1804461589773),
          Point(-4.855792124429867, 37.18108913443582),
          Point(-4.85624511894443, 37.1837967179202)]
2个回答

11

通过访问Pointxy属性,您可以获得两个坐标列表,并使用Matplotlib的plt.scatterplt.plot函数进行绘制,示例如下:

import matplotlib.pyplot as plt
from shapely.geometry import Point

points = [Point(-4.85624511894443, 37.1837967179202), 
          Point(-4.855703975302475, 37.18401757756585),
          Point(-4.85516283166052, 37.1842384372115),
          Point(-4.85343407576431, 37.182006629169),
          Point(-4.85347524651836, 37.1804461589773),
          Point(-4.855792124429867, 37.18108913443582),
          Point(-4.85624511894443, 37.1837967179202)]
xs = [point.x for point in points]
ys = [point.y for point in points]
plt.scatter(xs, ys)
# or plt.plot(xs, ys) if you want to connect points by lines

enter image description here


如果您正在使用Jupyter Notebook或Jupyter Lab,则可以将点列表包装在MultiPoint对象中以获取SVG图像。这对于调试目的很有用,当您想要快速绘制某些内容而不导入Matpotlib时。
>>> MultiPoint(points)

给出:
输入图像描述

哪个方法被称为导致图形显示的方法?例如,如果我想循环遍历Multipoint列表,如何显示每个点呢? - user3731622
1
我可以建议使用 xs, ys = zip(*[(point.x, point.y) for point in points]) 来避免双重循环。或者 xs, ys = zip(*[point.xy for point in points])。或者使用numpy, xs, ys = np.c_[[np.r_[point.xy] for point in points]].T - Kardo Paska

1

最简单的方法是使用Geopandas并构建一个GeoDataFrame

来自教程:

import geopandas as gpd
from shapely.geometry import Point
d = {'col1': ['P1', 'P2', 'P3', 'P4', 'P5', 'P6', 'P7'], 'geometry': [Point(-4.85624511894443, 37.1837967179202), 
      Point(-4.855703975302475, 37.18401757756585),
      Point(-4.85516283166052, 37.1842384372115),
      Point(-4.85343407576431, 37.182006629169),
      Point(-4.85347524651836, 37.1804461589773),
      Point(-4.855792124429867, 37.18108913443582),
      Point(-4.85624511894443, 37.1837967179202)]}
gdf = gpd.GeoDataFrame(d, crs="EPSG:4326")(choose your own crs)

然后只需绘制它:

gdf.plot()

网页内容由stack overflow 提供, 点击上面的
可以查看英文原文,
原文链接