我正在尝试绘制一条时间序列,每年都有不同的线。以这个例子为例:
library(ggplot2)
library(lubridate)
library(dplyr)

df = data.frame(dt = seq(as.Date("2015/01/01"), by = "day", length.out = 1000),
     num = c(sample(1:333), sample(333:665), sample(665:998)))
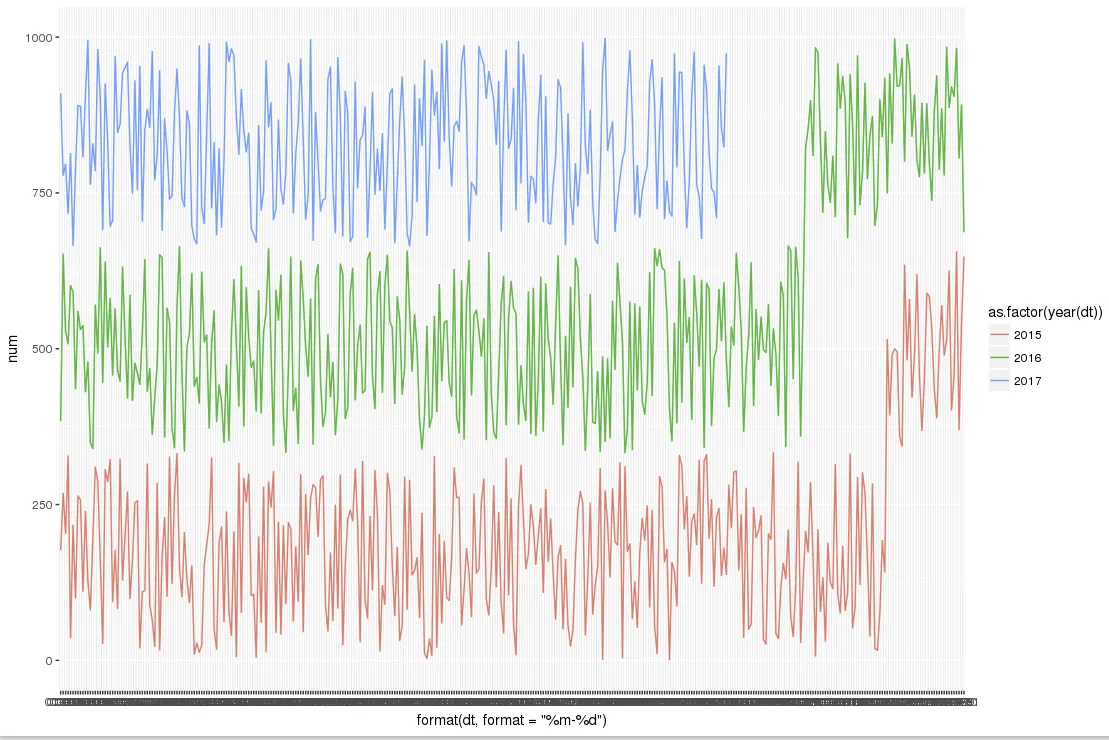
有了这个样本数据,我尝试绘图:
ggplot(df, aes(x= format(dt, format="%m-%d"), y=num, group = as.factor(year(dt))))
    + geom_line()
这会返回一个警告:
geom_path: Each group consists of only one observation. Do you need to adjust the group aesthetic?。将 color 替换为 group 可以得到类似于我想要的东西,但是由于 x 轴的类型是字符串,所以标签太多了。你如何使 x 轴仅显示每个月的第一天?或者有没有更好的方法来绘制这样的时间序列图?
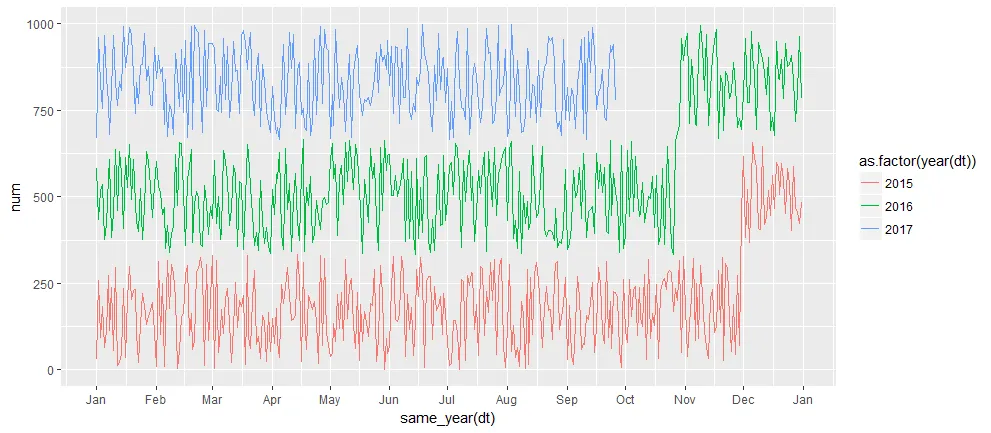
x=format(dt,format="%m-%d")并且改用x=dt,我得到了正确的格式。更多选项请参见 http://ggplot2.tidyverse.org/reference/scale_date.html。 - Jason