MATLAB中自动生成函数调用图的方法
18
- Amelio Vazquez-Reina
2
6我不知道有什么工具可以创建这个“图表”,但已经有一些关于如何在MATLAB中查找函数依赖的问题,(它们的输出可能被用于创建图形表示):如何在MATLAB中生成函数依赖列表?、MATLAB:从“命令行”确定依赖项,排除内置依赖项、MATLAB:如何找到使用给定函数的路径上的函数。 - gnovice
3如我在这里所提到的,你可以使用M2HTML工具箱(实际上它也使用GraphViz来生成调用图)。 - Amro
1个回答
27
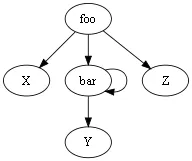
你可以使用gnovice评论中提到的其他答案中的技术,获取函数依赖关系列表,以(A,B)对的形式表示,其中A调用B。然后安装GraphViz并使用它生成图表。你可以使用类似以下的Matlab代码创建.dot文件。
function createFunctionDependencyDotFile(calls)
%CREATEFUNCTIONDEPENDENCYDOTFILE Create a GraphViz DOT diagram file from function call list
%
% Calls (cellstr) is an n-by-2 cell array in format {caller,callee;...}.
%
% Example:
% calls = { 'foo','X'; 'bar','Y'; 'foo','Z'; 'foo','bar'; 'bar','bar'};
% createFunctionDependencyDotFile(calls)

baseName = 'functionCalls';
dotFile = [baseName '.dot'];
fid = fopen(dotFile, 'w');
fprintf(fid, 'digraph G {\n');
for i = 1:size(calls,1)
    [parent,child] = calls{i,:};
    fprintf(fid, '   "%s" -> "%s"\n', parent, child);
end
fprintf(fid, '}\n');
fclose(fid);

% Render to image
imageFile = [baseName '.png'];
% Assumes the GraphViz bin dir is on the path; if not, use full path to dot.exe
cmd = sprintf('dot -Tpng -Gsize="2,2" "%s" -o"%s"', dotFile, imageFile);
system(cmd);
fprintf('Wrote to %s\n', imageFile);
GraphViz 适用于许多其他树形和图形应用,例如类继承和依赖树、数据流等。
- Andrew Janke
5
+1 是因为你向我介绍了 GraphViz。感谢提供链接! - b3.
提供一个直观的例子,加1! - Amelio Vazquez-Reina
1这可能会有所帮助,https://www.mathworks.com/matlabcentral/fileexchange/27608-graphviz-like-tools-for-matlab - KAE
GraphViz适用于Octave吗?还是有类似的其他工具? - Ziezi
当然。GraphViz是一个外部程序。Matlab代码所做的一切都是生成一个文本文件,其中包含一个“DOT”格式文档供GraphViz读取。如果您可以在Octave中获取函数依赖数据,则可以以相同的方式生成DOT文件。 - Andrew Janke
网页内容由stack overflow 提供, 点击上面的可以查看英文原文,
原文链接
原文链接