我有一个包含十进制值的大矩阵。
我想在Matlab中用灰度热图绘制它。
该怎么做呢?
我尝试使用rgb2gray函数,但是为了使用它,我需要先创建一张图片。在Matlab中如何实现这一点呢?
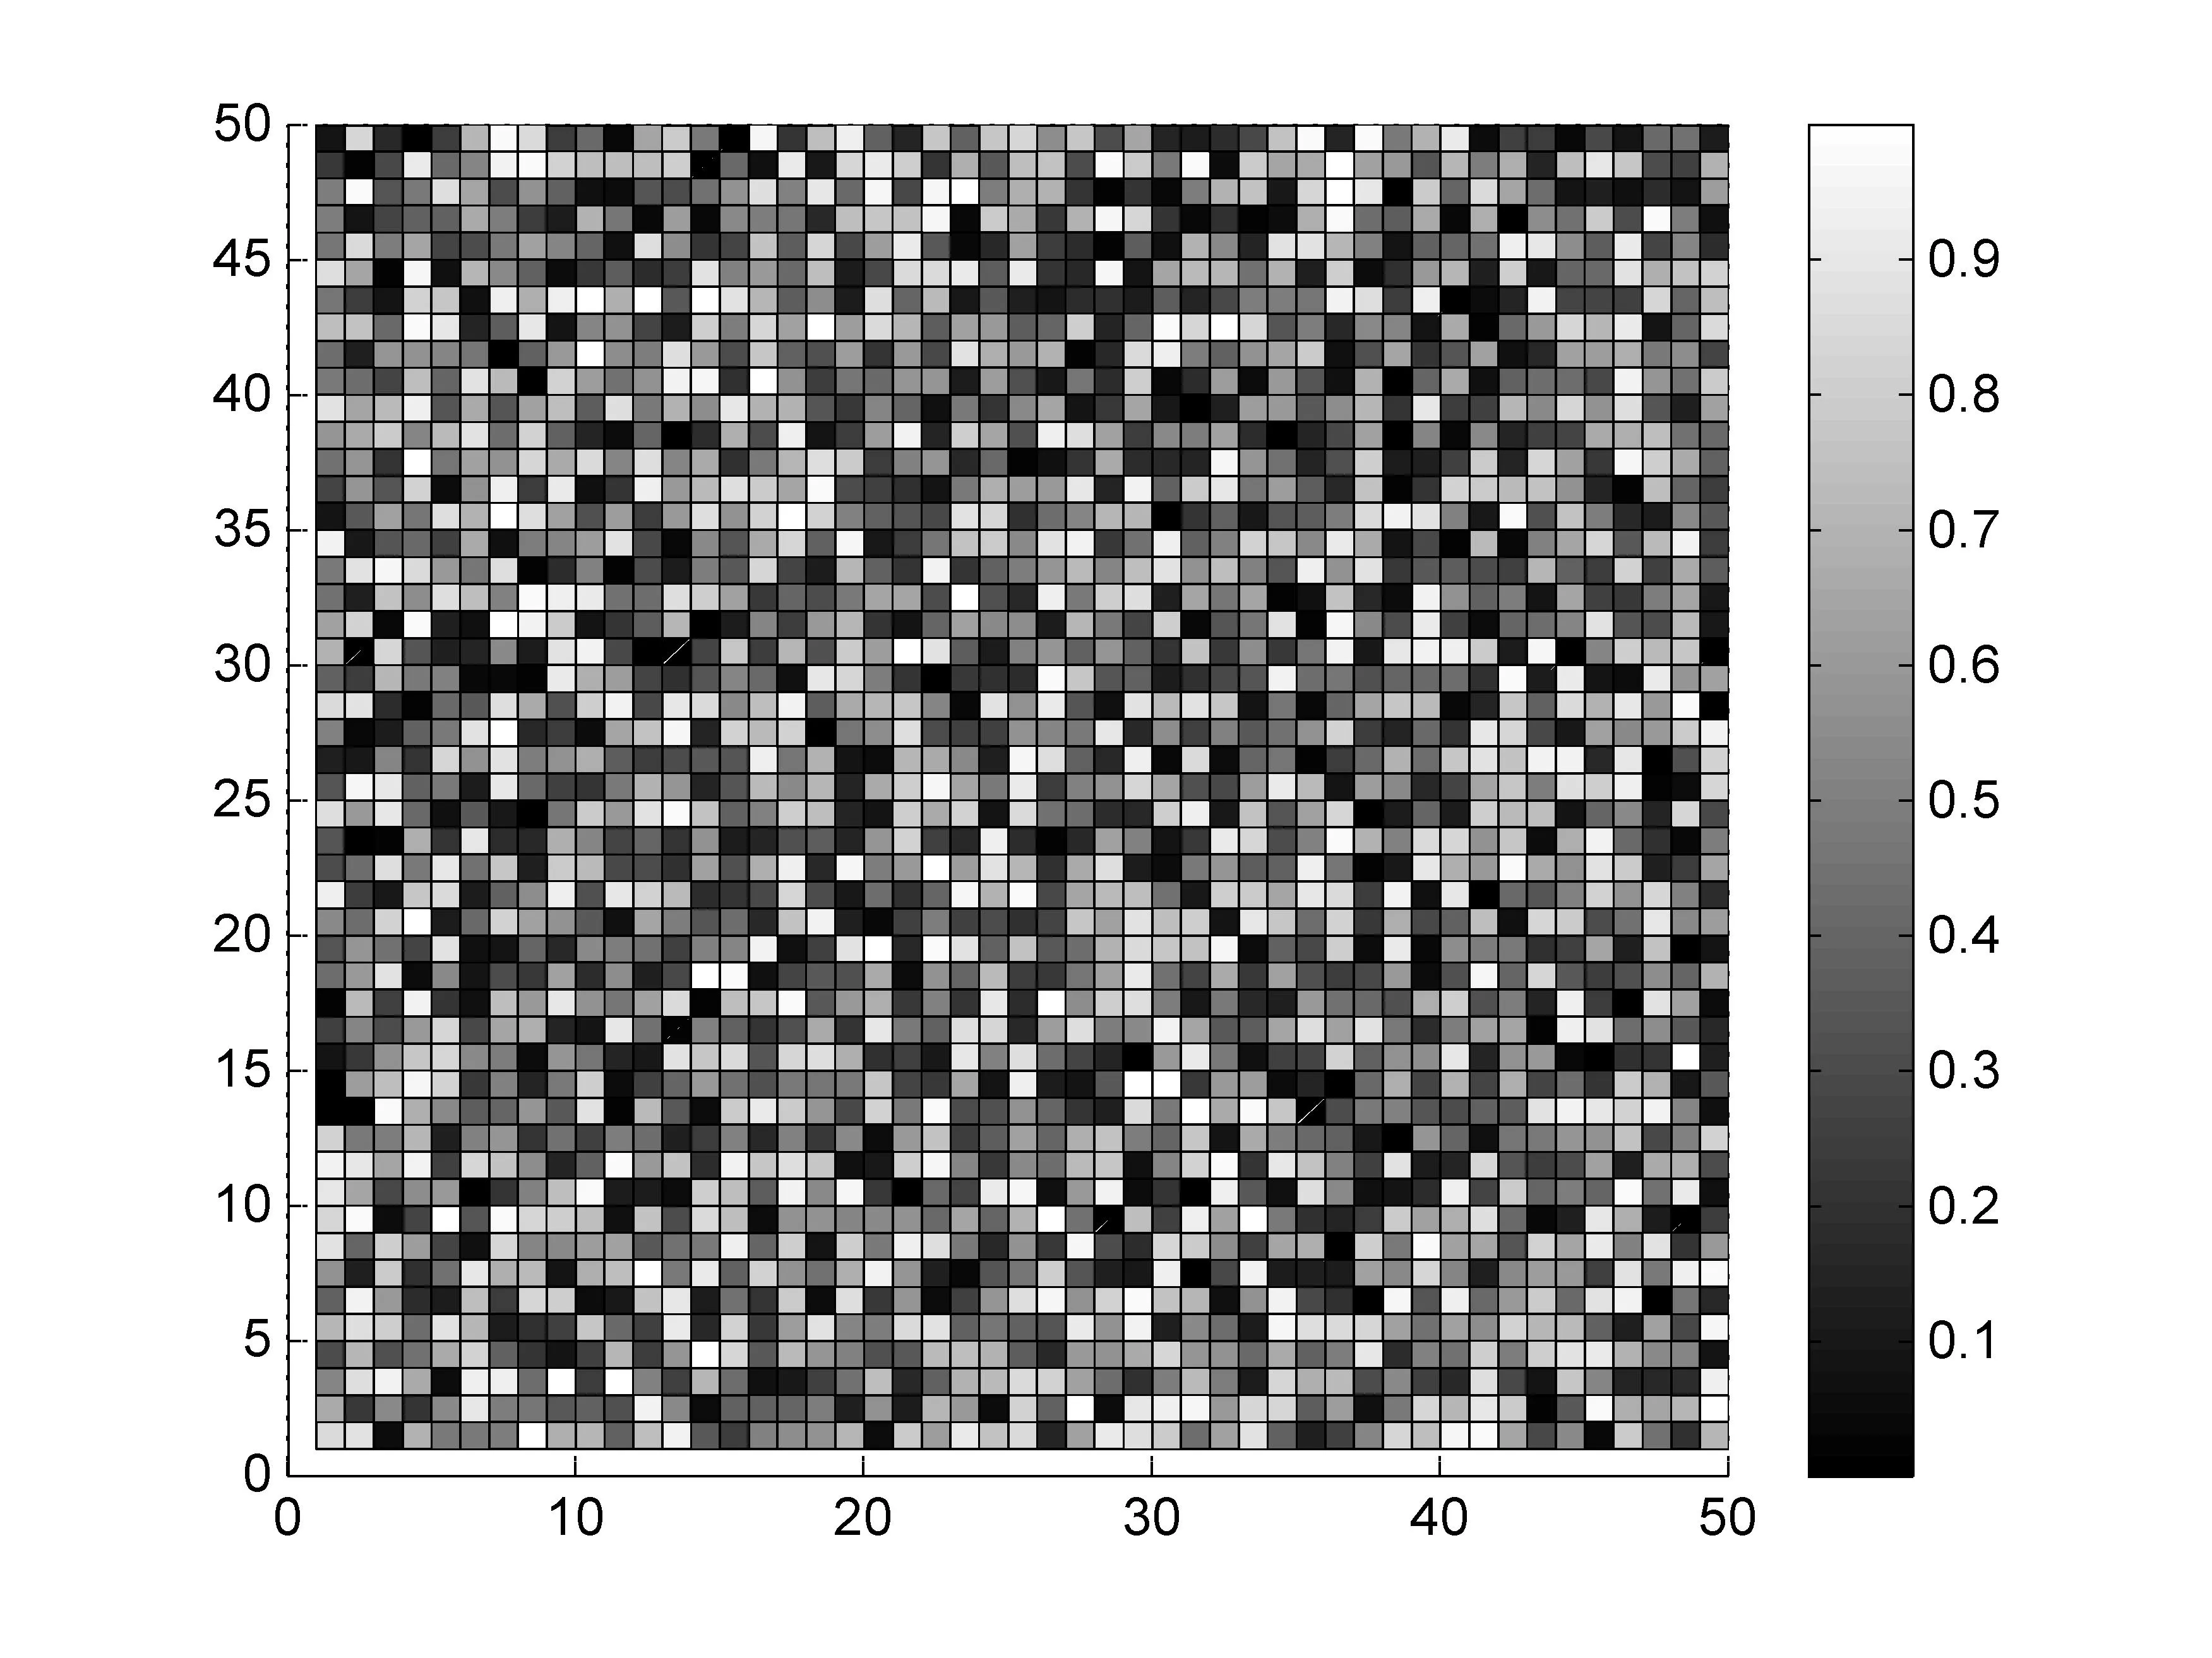
imagesc 可以完成这个任务。
imagesc(img)
axis equal off
colormap gray
colorbar
imshow 也可以使用。 - chappjcsurf-plot。
您的矩阵:
A = rand(50,50);
surf(A);
view(0,90)
colormap(gray)
并且将颜色条作为图例:
colorbar
示例代码:
myImage = mat2gray(myMatrix); % Converts your data to an image.
figure; hold on; % Creates a figure
imshow(myImage); % Show image
colormap(jet); % Sets the color map you want
colorbar; % Show a color bar on the right
以下是一些可能会对您感兴趣的颜色地图:
喷气式

热图 
我认为jet代表了一个热度图。
更多信息,请参见Mathworks colormap page。