我正在尝试为约500个Matlab源文件创建函数调用图。我无法找到任何可帮助我同时处理多个源文件的工具。
是否有人熟悉任何工具或插件?
如果没有此类工具,欢迎提供阅读6000行Matlab代码且没有文档的建议。
我正在尝试为约500个Matlab源文件创建函数调用图。我无法找到任何可帮助我同时处理多个源文件的工具。
是否有人熟悉任何工具或插件?
如果没有此类工具,欢迎提供阅读6000行Matlab代码且没有文档的建议。
我建议使用depfun函数来构建调用图。更多信息,请参见http://www.mathworks.com/help/techdoc/ref/depfun.html。
特别地,我发现使用'-toponly'参数调用depfun函数,然后迭代结果,是手动构建调用图的绝佳方式。不幸的是,我不再有任何使用这种方法编写的代码的访问权限了。
我理解您想要查看代码的运行情况 - 哪些函数调用了哪些子函数,何时调用以及这些函数运行的时间长度?
可以使用MATLAB代码分析器来查看。执行以下步骤:
>> profile on -history; MyCode; profile viewer
>> p = profile('info');
p 包含历史函数,从我上面链接的同一帮助页面中可以查看到:
历史数据描述了执行期间输入和退出的函数顺序。
profile命令返回结构体中的FunctionHistory字段中的历史数据。历史数据是一个 2 x n 的数组。第一行包含布尔值,其中0表示进入函数,而1表示退出函数。第二行通过其在FunctionTable字段中的索引标识正在进入或退出的函数。下面的示例读取历史数据,并在 MATLAB 命令窗口中显示它。
profile on -history
plot(magic(4));
p = profile('info');
for n = 1:size(p.FunctionHistory,2)
if p.FunctionHistory(1,n)==0
str = 'entering function: ';
else
str = 'exiting function: ';
end
disp([str p.FunctionTable(p.FunctionHistory(2,n)).FunctionName])
end
您不一定需要像上面的示例那样显示入口和出口调用;仅查看p.FunctionTable和p.FunctionHistory就足以显示代码何时进入和退出函数。
profile函数,并使用digraph来表示数据。profile on
Main % Code to be analized
p = profile('info');
p 是一个结构体。特别地,它包含了字段 FunctionTable,这是一个结构体数组,其中每个结构体都包含了关于执行 Main.m 中一个调用的信息。为了只保留函数,我们需要对于 FunctionTable 中的每个元素进行检查,看它是否是一个函数,即看 p.FunctionTable(ii).Type 是否为 'M-function'。N = numel(p.FunctionTable);
G = digraph;
G = addnode(G,N);
nlabels = {};
for ii = 1:N
Children = p.FunctionTable(ii).Children;
if ~isempty(Children)
for jj = 1:numel(Children)
G = addedge(G,ii,Children(jj).Index);
end
end
end
Count = 1;
for ii=1:N
if ~strcmp(p.FunctionTable(ii).Type,'M-function') % Keep only the functions
G = rmnode(G,Count);
else
Nchars = min(length(p.FunctionTable(ii).FunctionName),10);
nlabels{Count} = p.FunctionTable(ii).FunctionName(1:Nchars);
Count = Count + 1;
end
end
plot(G,'NodeLabel',nlabels,'layout','layered')
G 是一个有向图,其中 node #i 指的是结构数组 p.FunctionTable 中的第 i 个元素,如果由 node #i 表示的函数是由 node #j 表示的函数的父函数,则存在一条从 node #i 到 node #j 的边。
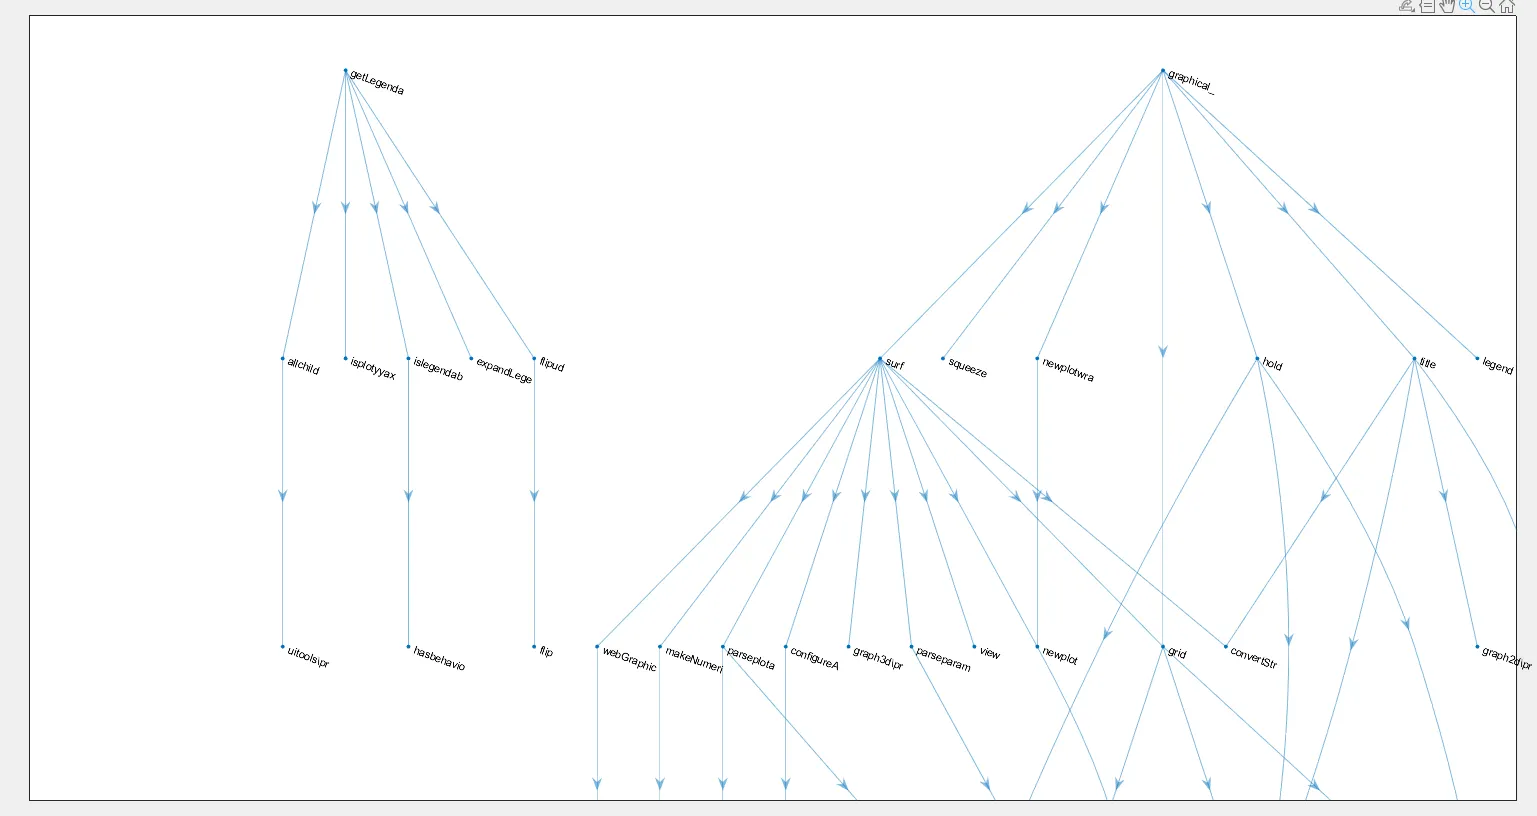
应用于我的大型程序时,这个图看起来非常丑陋,但对于较小的函数可能会更好看:
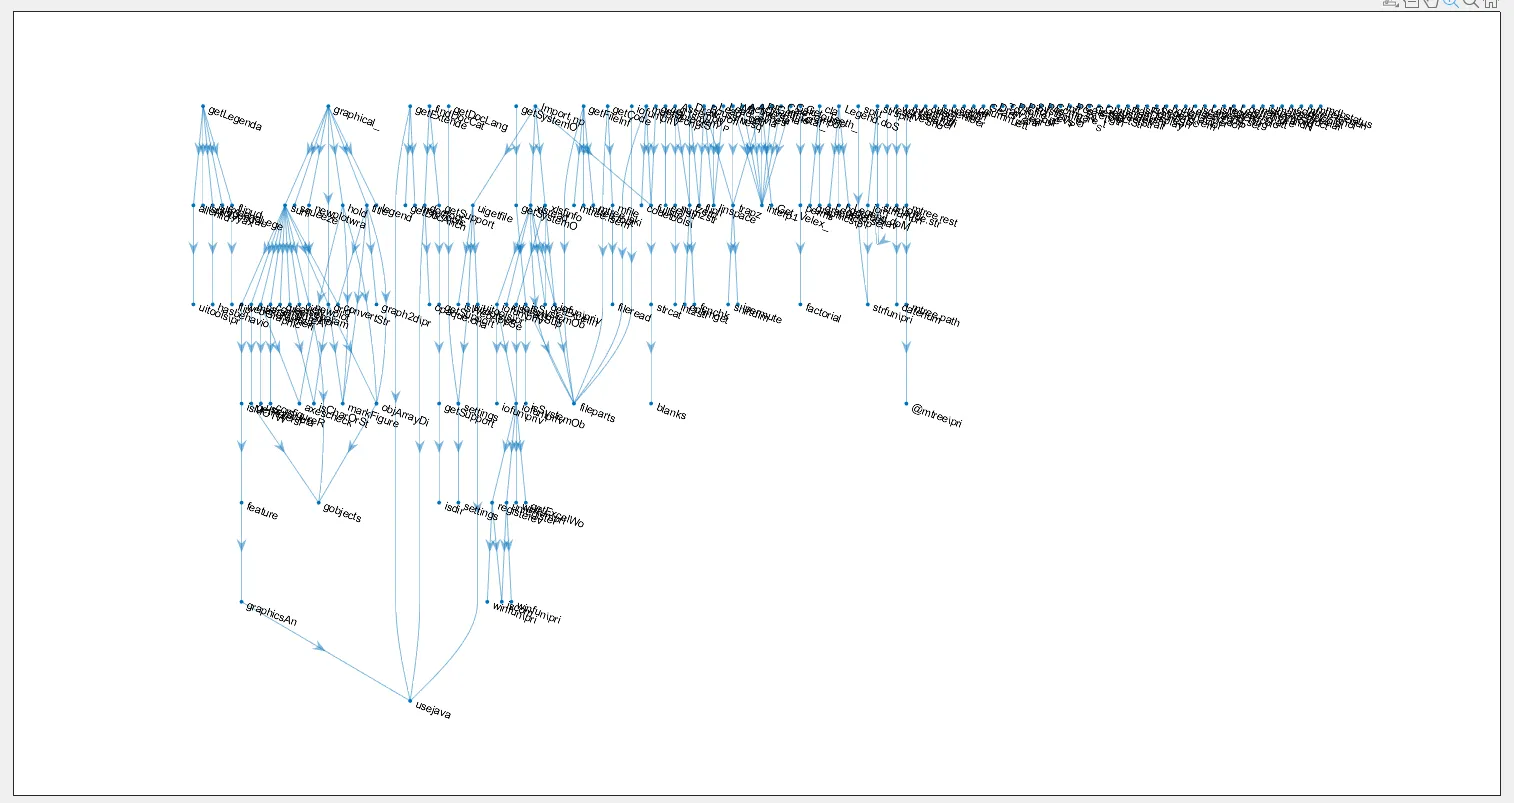
放大图形的一部分:
我同意m2html的答案,我只想说一下m2html/mdot文档中的示例很好:
mdot('m2html.mat','m2html.dot');
!dot -Tps m2html.dot -o m2html.ps
!neato -Tps m2html.dot -o m2html.ps
但是我在导出为pdf方面运气更好:
mdot('m2html.mat','m2html.dot');
!dot -Tpdf m2html.dot -o m2html.pdf
另外,在尝试上述命令之前,您必须执行类似以下的操作:
m2html('mfiles','..\some\dir\with\code\','htmldir','doc_dir','graph','on')
我发现m2html非常有帮助(与Graphviz软件结合使用)。 然而,在我的情况下,我想创建一个包含文件夹中程序的文档,但忽略一些子文件夹和.m文件。 我发现,通过在m2html调用中添加“ignoreddir”标志,可以使程序忽略一些子文件夹。 但是,我没有找到忽略.m文件的类似标志(“ignoreddir”标志也不能完成任务)。 作为解决方法,在m2html.m文件的第1306行后添加以下行允许使用“ignoreddir”标志同时忽略.m文件:
d = {d{~ismember(d,{ignoredDir{:}})}};
所以,例如,为了生成位于文件夹“program_folder”中的程序的HTML文档,但忽略“subfolder_1”子文件夹和“test.m”文件,应该执行以下操作:
m2html( 'mfiles', 'program_folder', ... % set program folder
'save', 'on', ... % provide the m2html.mat
'htmldir', './doc', ... % set doc folder
'graph', 'on', ... % produce the graph.dot file to be used for the visualization, for example, as a flux/block diagram
'recursive', 'on', ... % consider also all the subfolders inside the program folders
'global', 'on', ... % link also calls between functions in different folders, i.e., do not link only the calls for the functions which are in the same folder
'ignoreddir', { 'subfolder_1' 'test.m' } ); % ignore the following folders/files
mdot('m2html.mat','m2html.dot'); !dot -Tps m2html.dot -o m2html.ps !neato -Tps m2html.dot -o m2html.ps- Dave C