在将matplotlib版本从1.3.1更新到2.0.2后,当我想使用plot_trisurf通过3D点生成TIN时,我得到了难以理解的结果。我的测试代码如下:
import sys
import matplotlib
import matplotlib.pyplot as plt
from matplotlib.ticker import MaxNLocator
from matplotlib import cm
from mpl_toolkits.mplot3d import Axes3D
import numpy
from numpy.random import randn
from scipy import array, newaxis

chunk = numpy.loadtxt('test.xyz')  #test.xyz contains 38010 points,
DATA=numpy.array(chunk)
Xs = DATA[:,0]
Ys = DATA[:,1]
Zs = DATA[:,2]

fig = plt.figure()
ax = fig.add_subplot(111, projection='3d')

surf = ax.plot_trisurf(Xs, Ys, Zs, cmap=cm.jet, linewidth=0)
fig.colorbar(surf)

ax.xaxis.set_major_locator(MaxNLocator(5))
ax.yaxis.set_major_locator(MaxNLocator(6))
ax.zaxis.set_major_locator(MaxNLocator(5))

fig.tight_layout()
plt.show()
test.xyz文件包含38010个点。以下是其中一部分内容,完整文件可以在这里找到。
512743.63 5403547.33 308.68
512743.62 5403547.33 308.70
512743.61 5403547.33 308.72
512743.60 5403547.34 308.68
512743.60 5403547.33 308.73
512741.50 5403547.36 309.05
512741.50 5403547.36 309.07
512741.49 5403547.46 309.09
512741.48 5403547.46 309.07
512741.47 5403547.46 309.10
512741.47 5403547.45 309.13
512741.46 5403547.37 309.04
512739.39 5403547.51 309.10
512739.39 5403547.48 309.34
512739.38 5403547.60 309.25
512739.37 5403547.71 309.15
512739.39 5403547.49 310.65
512739.39 5403547.48 310.70
512739.38 5403547.49 310.69
512739.37 5403547.48 310.72
512739.36 5403547.39 310.64
512739.32 5403547.41 309.20
512737.33 5403547.26 313.14
512737.33 5403547.37 313.09
512737.32 5403547.38 313.03
512737.30 5403547.37 313.12
512737.30 5403547.26 313.14
512735.22 5403547.41 311.72
512735.22 5403547.43 312.29
512735.22 5403547.49 312.59
512735.21 5403547.51 312.48
512735.20 5403547.60 312.53
512735.19 5403547.61 312.48
512735.18 5403547.72 312.40
512735.18 5403547.71 312.49
512735.17 5403547.71 312.51
512735.16 5403547.70 312.58
512735.15 5403547.61 312.52
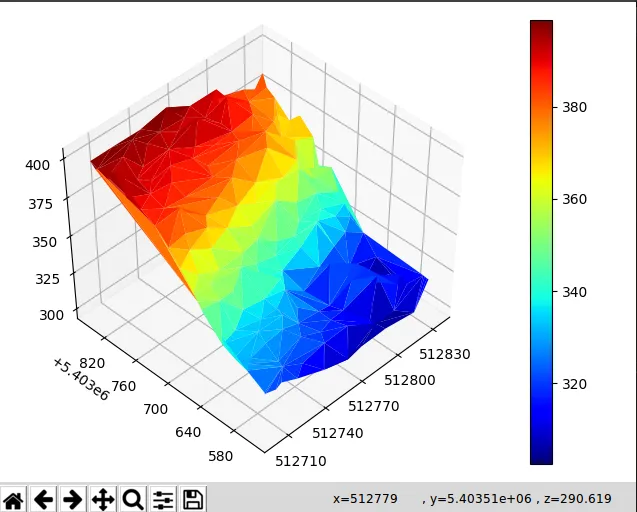
更新后,结果显示为:
![]](https://istack.dev59.com/tkClU.webp) 。
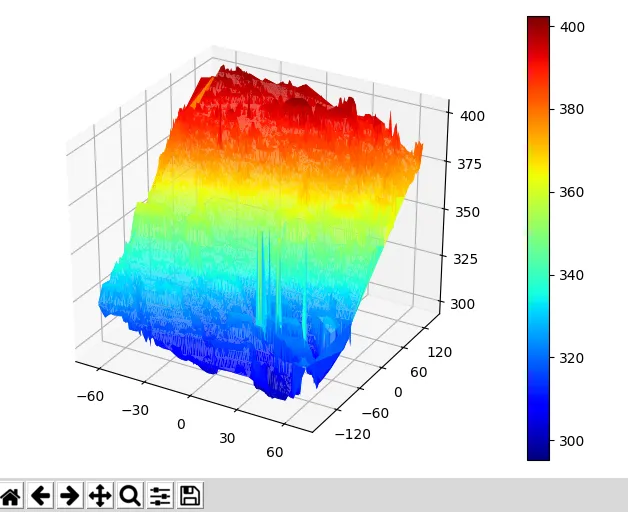
我认为这是错误的,因为我提供了足够的点来生成一个TIN,但结果似乎只使用了一小部分点。在更新matplotlib之前,我可以得到如下结果:
。
我认为这是错误的,因为我提供了足够的点来生成一个TIN,但结果似乎只使用了一小部分点。在更新matplotlib之前,我可以得到如下结果:![]](https://istack.dev59.com/9TKo2.webp) 。
。