从numpy或pandas邻接矩阵创建igraph图

26

我有一个存储在 pandas.DataFrame 中的邻接矩阵:

node_names = ['A', 'B', 'C']
a = pd.DataFrame([[1,2,3],[3,1,1],[4,0,2]],
    index=node_names, columns=node_names)
a_numpy = a.as_matrix()

我希望能够从 pandasnumpy 的邻接矩阵中创建一个 igraph.Graph 对象。在理想的情况下,节点应该按预期命名。

这个可能吗?教程似乎没有提到这个问题。


严格来说,邻接矩阵是布尔型的。a_numpy 中的值实际上是什么意思?它们是连接权重吗? - ali_m
@ali_m 我的意思是它们表示边缘权重。 - LondonRob
3个回答

41

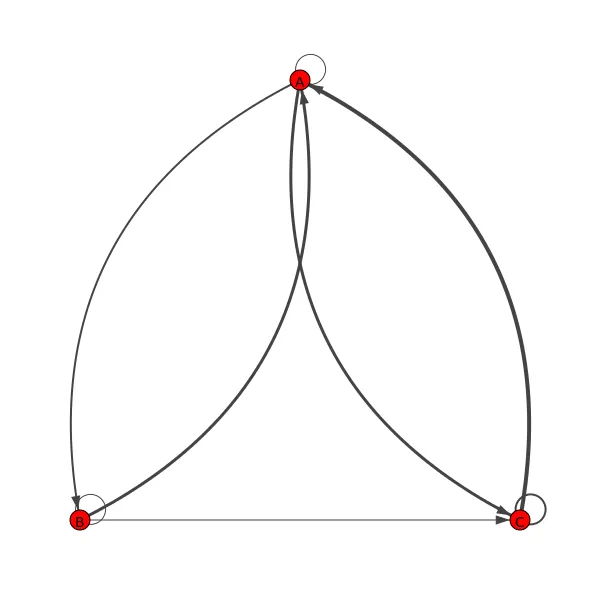
在 iGraph 中,您可以使用 igraph.Graph.Adjacency 从邻接矩阵创建一个图,而不需要使用 zip。 当使用加权邻接矩阵并将其存储在 np.arraypd.DataFrame 中时,需要注意一些事情。

  • igraph.Graph.Adjacency 不能将 np.array 作为参数,但可以使用 tolist 转换。

  • 邻接矩阵中的整数被解释为节点之间的边数而不是权重,可以通过将邻接矩阵设置为布尔类型来解决。

以下是一个示例:

import igraph
import pandas as pd

node_names = ['A', 'B', 'C']
a = pd.DataFrame([[1,2,3],[3,1,1],[4,0,2]], index=node_names, columns=node_names)

# Get the values as np.array, it's more convenenient.
A = a.values

# Create graph, A.astype(bool).tolist() or (A / A).tolist() can also be used.
g = igraph.Graph.Adjacency((A > 0).tolist())

# Add edge weights and node labels.
g.es['weight'] = A[A.nonzero()]
g.vs['label'] = node_names  # or a.index/a.columns

您可以使用get_adjacency方法重建邻接数据框:

df_from_g = pd.DataFrame(g.get_adjacency(attribute='weight').data,
                         columns=g.vs['label'], index=g.vs['label'])
(df_from_g == a).all().all()  # --> True

2
很好!加1是因为“Adjacency”将数字解释为链接的数量,而不是链接权重。 - LondonRob
2
如果行是“起始节点”,列是“终止节点”,您将如何将此图转换为有向版本? - sachinruk
2
a.to_numpy() is preferred to a.values - rlchqrd

14

严格来说,邻接矩阵是布尔型的,其中1表示存在连接,0表示不存在。由于你的a_numpy矩阵中许多值都>1,因此我会假设它们对应于图中的边权重。

import igraph

# get the row, col indices of the non-zero elements in your adjacency matrix
conn_indices = np.where(a_numpy)

# get the weights corresponding to these indices
weights = a_numpy[conn_indices]

# a sequence of (i, j) tuples, each corresponding to an edge from i -> j
edges = zip(*conn_indices)

# initialize the graph from the edge sequence
G = igraph.Graph(edges=edges, directed=True)

# assign node names and weights to be attributes of the vertices and edges
# respectively
G.vs['label'] = node_names
G.es['weight'] = weights

# I will also assign the weights to the 'width' attribute of the edges. this
# means that igraph.plot will set the line thicknesses according to the edge
# weights
G.es['width'] = weights

# plot the graph, just for fun
igraph.plot(G, layout="rt", labels=True, margin=80)

在此输入图片描述


1

这是可能的,使用igraph.Graph.Weighted_Adjacency作为

g = igraph.Graph.Weighted_Adjacency(a.to_numpy().tolist())

pandas.DataFrame.as_matrix已经被弃用, 因此应该使用pandas.DataFrame.to_numpy。 此外,a.to_numpy()返回的numpy.ndarray在传递给Weighted_Adjacency之前必须使用tolist()转换为列表。

节点名称可以作为另一个属性存储。

g.vs['name'] = node_names

网页内容由stack overflow 提供, 点击上面的
可以查看英文原文,
原文链接