ggplot2分面中的单个竖线

4
我有一个包含一些简单信息的数据框。每个样本都有一个样本代码(A、C、T或G)和一些计数。我还有一个数据框,其中包含我想要绘制为每个代码的垂直线的一些均值。不幸的是,当我进行绘图时,所有均值都显示在所有图上。有没有办法按顺序在一个图中绘制一条垂直线?
非常感谢,下面是一个简单的示例
虚拟数据
sample <- c(1:100)
code <- c(rep("A", 25), rep("C", 25),rep("G", 25),rep("T", 25))
count <- sample(1:30, 100, replace=T)
df <- data.frame(sample, code, count)


vline.data <- data.frame(z = c(15, 20, 25, 30))

ggplot(df, aes(x=count))+
  geom_histogram(binwidth=.5)+
  facet_grid(. ~ code)+
  geom_vline(aes(xintercept = z), vline.data)+
  theme(axis.title.x=element_text(),
        axis.title.y=element_text(),
        legend.position="none")

1
使用 
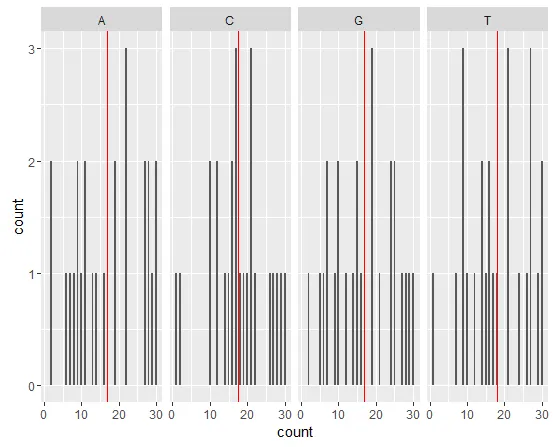
vline.data <- data.frame(z = c(15, 20, 25, 30), code=c("A","C","G","T"))。这是如何将每个值与特定的面板关联起来。除了创建新的数据框之外,您还可以使用 dplyr 包在运行时执行此操作:library(dplyr),然后在 ggplot 代码中:geom_vline(aes(xintercept = z), df %>% group_by(code) %>% summarise(z=mean(count))) + - eipi10
看到你编辑过的帖子了,现在使用当前的代码可以正常运行。 - Stephen Williams
第一次多年后登录SO,只是为了感谢@eipi10的1百万。我花了很多时间在奇怪的错误信息中挣扎。我一直在制作一个单独的DF(基本上使用您相同的dplyr),但由于某种原因,这会导致错误或将每个facet中的所有行放在此处报告的OP中。使用您的方法可以得到所需的结果。非常感谢! - user3250815
1个回答

3
也许这个可以帮到您:
sample <- c(1:100)
code <- c(rep("A", 25), rep("C", 25),rep("G", 25),rep("T", 25))
count <- sample(1:30, 100, replace=T)
df <- data.frame(sample, code, count)

library(dplyr)

vline.data <- df %>%
              group_by(code) %>%
              summarize(z = mean(count))

ggplot(df, aes(x=count))+
  geom_histogram(binwidth=.5)+
  facet_grid(. ~ code)+
  geom_vline(aes(xintercept = z), vline.data, colour = "red")+
  theme(axis.title.x=element_text(),
        axis.title.y=element_text(),
        legend.position="none")

enter image description here


网页内容由stack overflow 提供, 点击上面的
可以查看英文原文,
原文链接