Matplotlib中不需要的空白子图

3

绘图

我刚开始学习matplotlib和seaborn,目前正在尝试使用经典的泰坦尼克号数据集来练习这两个库。虽然可能很基础,但我正在尝试通过输入参数ax = matplotlib axis来将两个factorplots并排绘制,如下面代码所示:

import matploblib.pyplot as plt
import seaborn as sns
%matplotlib inline 

fig, (axis1,axis2) = plt.subplots(1,2,figsize=(15,4))
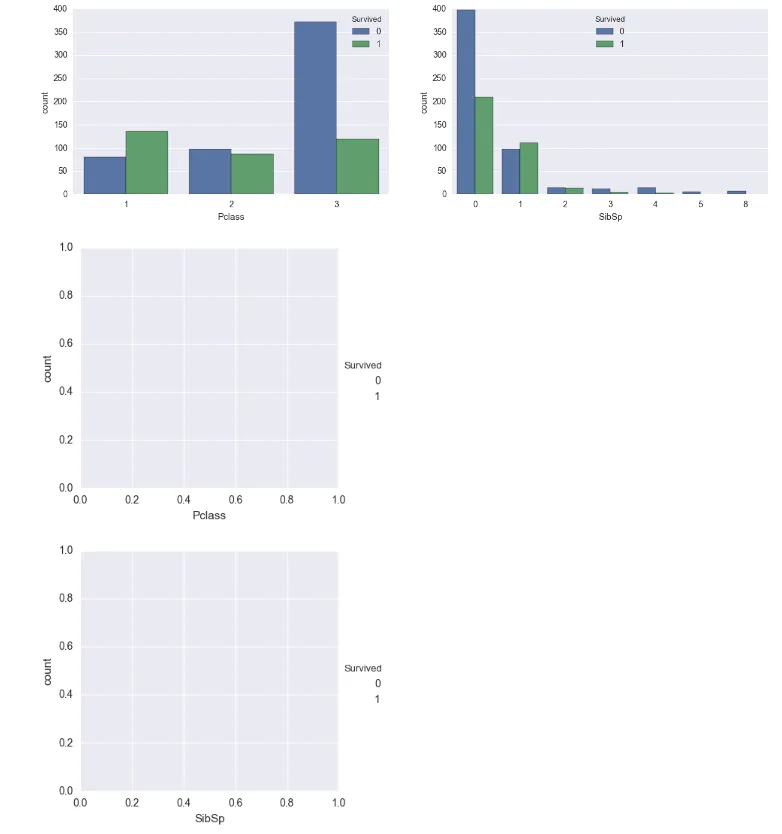
sns.factorplot(x='Pclass',data=titanic_df,kind='count',hue='Survived',ax=axis1)
sns.factorplot(x='SibSp',data=titanic_df,kind='count',hue='Survived',ax=axis2)

我原本期望两个因素图并排呈现,但最终除此之外还多了两个空白子图,如上所示。

1
https://dev59.com/bmAg5IYBdhLWcg3wG30K - mwaskom
1个回答

6
任何对的调用实际上都会创建一个新图形,尽管内容是绘制在现有轴(axes1, axes2)上的。这些图形与原始fig一起显示。
我猜最简单的方法防止那些未使用的图形出现是关闭它们,使用plt.close(<figure number>)
这里是笔记本的一个解决方案。
import matplotlib.pyplot as plt
import seaborn as sns
import pandas as pd
%matplotlib inline

titanic_df = pd.read_csv(r"https://github.com/pcsanwald/kaggle-titanic/raw/master/train.csv")

fig, (axis1,axis2) = plt.subplots(1,2,figsize=(15,4))
sns.factorplot(x='pclass',data=titanic_df,kind='count',hue='survived',ax=axis1)
sns.factorplot(x='sibsp',data=titanic_df,kind='count',hue='survived',ax=axis2)
plt.close(2)
plt.close(3)

(对于普通的控制台绘图,请移除%matplotlib inline命令并在结束时添加plt.show()。)

网页内容由stack overflow 提供, 点击上面的
可以查看英文原文,
原文链接