Matplotlib中的半小提琴图
13
- Ruggero Turra
3
seaborn可以绘制成对的半小提琴图,从这里开始可能会更容易:http://stanford.edu/~mwaskom/software/seaborn-dev/generated/seaborn.violinplot.html - cphlewis
评论中的 Stanford 链接似乎已经失效。 - Phil B
2@PhilB Seaborn现在已经将其文档页面放在pydata上了:https://seaborn.pydata.org/generated/seaborn.violinplot.html - JohanC
1个回答
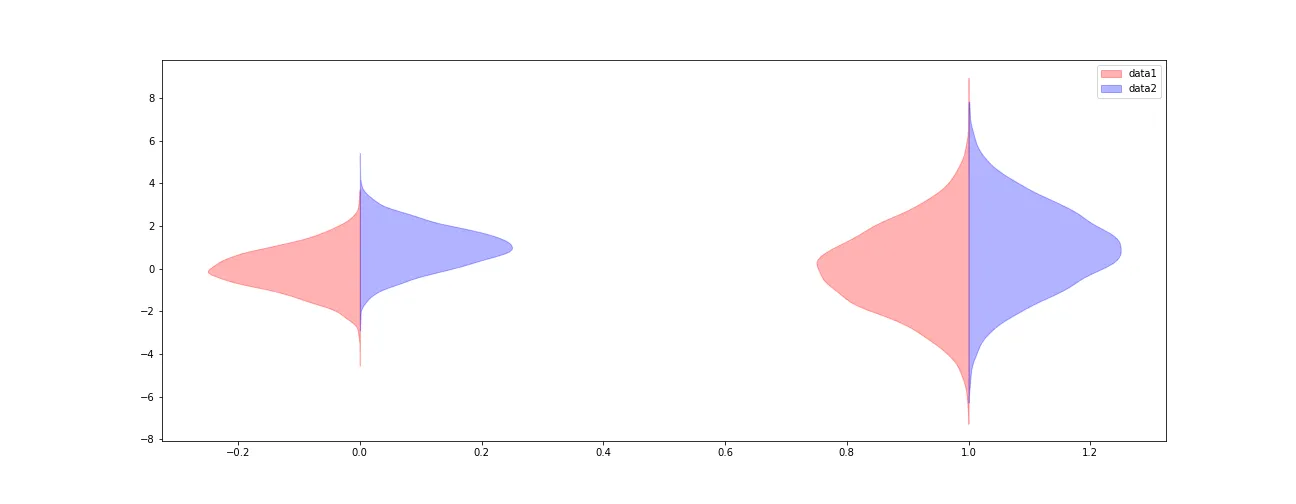
30
data1 = (np.random.normal(0, 1, size=10000), np.random.normal(0, 2, size=10000))
data2 = (np.random.normal(1, 1, size=10000), np.random.normal(1, 2, size=10000))

fig, ax = plt.subplots(figsize=(18, 7))

v1 = ax.violinplot(data1, points=100, positions=np.arange(0, len(data1)),
               showmeans=False, showextrema=False, showmedians=False)
for b in v1['bodies']:
    # get the center
    m = np.mean(b.get_paths()[0].vertices[:, 0])
    # modify the paths to not go further right than the center
    b.get_paths()[0].vertices[:, 0] = np.clip(b.get_paths()[0].vertices[:, 0], -np.inf, m)
    b.set_color('r')

v2 = ax.violinplot(data2, points=100, positions=np.arange(0, len(data2)),
               showmeans=False, showextrema=False, showmedians=False)

for b in v2['bodies']:
    # get the center
    m = np.mean(b.get_paths()[0].vertices[:, 0])
    # modify the paths to not go further left than the center
    b.get_paths()[0].vertices[:, 0] = np.clip(b.get_paths()[0].vertices[:, 0], m, np.inf)
    b.set_color('b')

ax.legend([v1['bodies'][0],v2['bodies'][0]],['data1', 'data2'])
- Ruggero Turra
1
3有些评论可能会有所帮助...谢谢。 - sol
网页内容由stack overflow 提供, 点击上面的可以查看英文原文,
原文链接
原文链接