我想创建一个小提琴图,使用matplotlib或seaborn,图表根据色彩映射进行着色。
这是我得到的结果: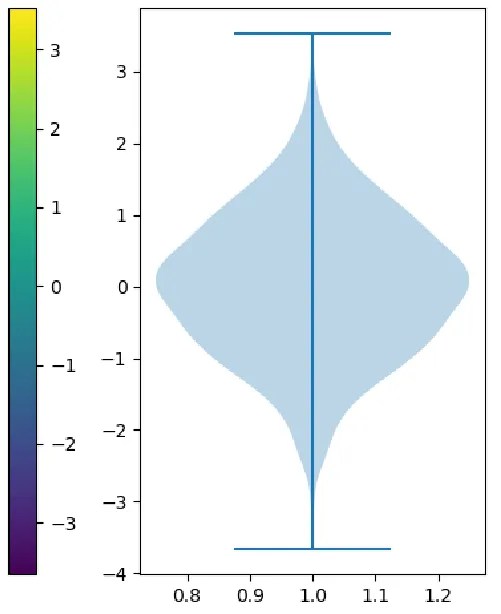 这是我想要的结果(我在Photoshop中制作了此图):
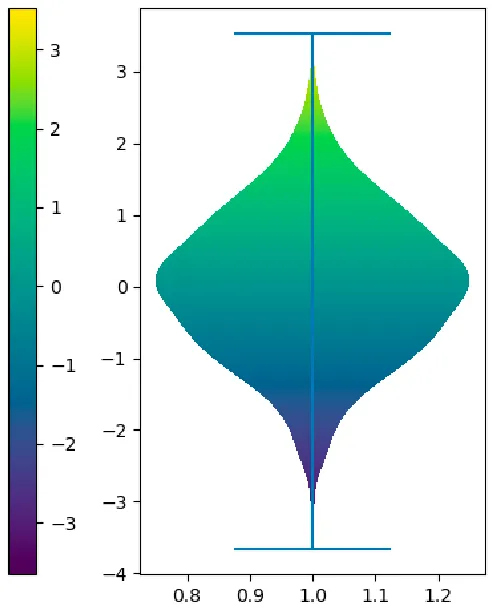
 如何获得所需的图表?
这是我得到的结果:
这是我想要的结果(我在Photoshop中制作了此图):
如何获得所需的图表?
这是我想要的结果(我在Photoshop中制作了此图):
如何获得所需的图表?我认为应该有更好的方法来做这件事,但基于@ImportanceOfBeingErnest的评论,我想这实际上是正确的方法:
from matplotlib.path import Path
from matplotlib.patches import PathPatch
from mpl_toolkits.axes_grid1.axes_divider import make_axes_locatable


x = [np.random.normal(loc=i, scale=1, size=(100,)) for i in range(5)]

fig, ax = plt.subplots()
violins = ax.violinplot(x)

ymin, ymax = ax.get_ylim()
xmin, xmax = ax.get_xlim()

# create a numpy image to use as a gradient
Nx,Ny=1,1000
imgArr = np.tile(np.linspace(0,1,Ny), (Nx,1)).T
cmap = 'hsv'

for violin in violins['bodies']:
    path = Path(violin.get_paths()[0].vertices)
    patch = PathPatch(path, facecolor='none', edgecolor='none')
    ax.add_patch(patch)
    img = ax.imshow(imgArr, origin="lower", extent=[xmin,xmax,ymin,ymax], aspect="auto",
                    cmap=cmap,
                    clip_path=patch)

# colorbar
ax_divider = make_axes_locatable(ax)
cax = ax_divider.append_axes("right", size="5%", pad="2%")
norm = matplotlib.colors.Normalize(vmin=ymin, vmax=ymax)
cb = matplotlib.colorbar.ColorbarBase(cax, cmap=matplotlib.cm.get_cmap(cmap),
                                norm=norm,
                                orientation='vertical')
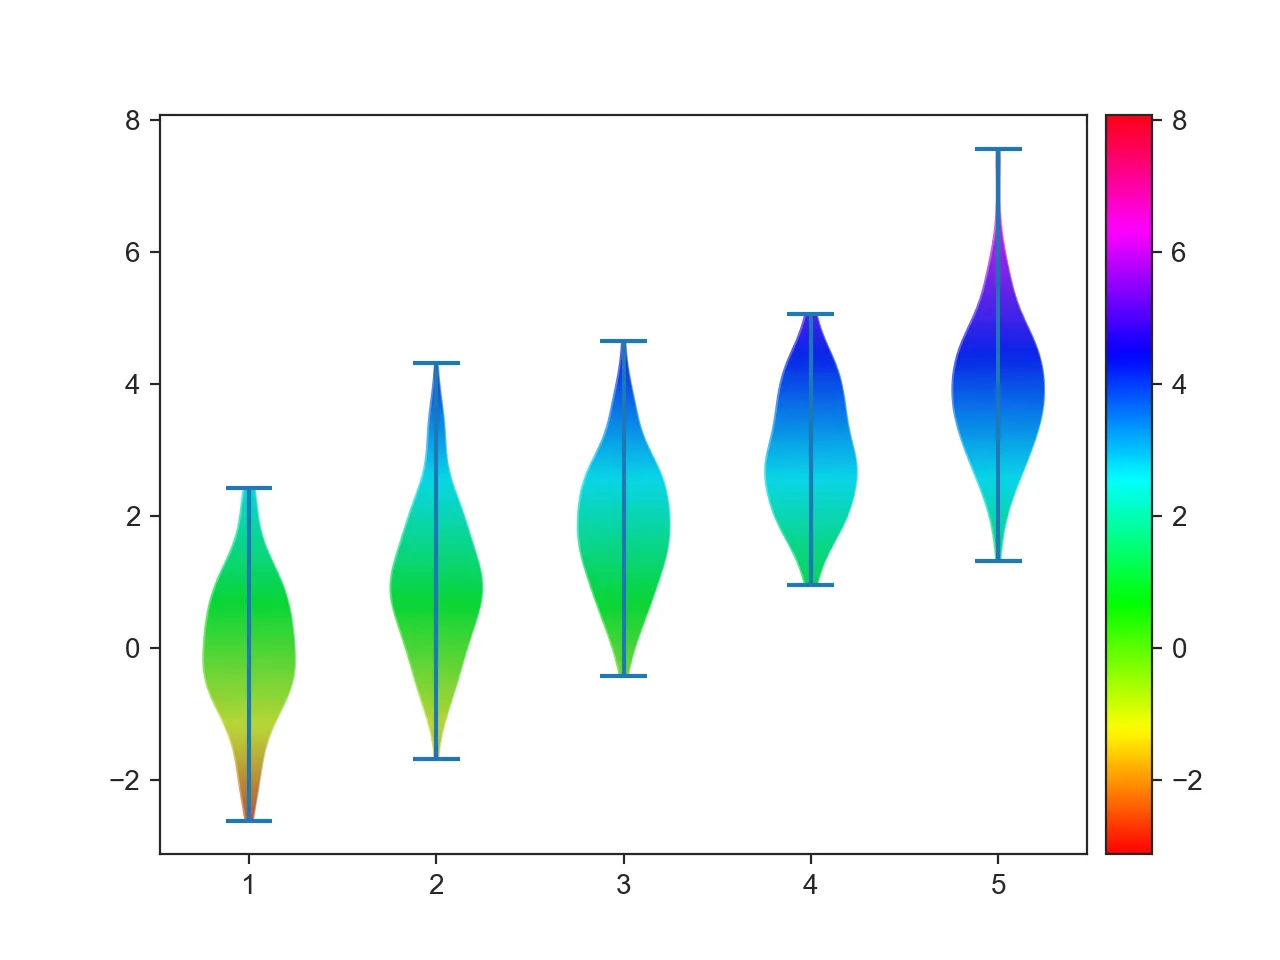
ColorbarBase和适当的规范化来创建一个色条。我已经修改了我的答案。 - Diziet Asahi
imshow并使用小提琴轮廓作为图像的clip_path。 - ImportanceOfBeingErnest