Matplotlib中Poly3DCollection图的透明度

18

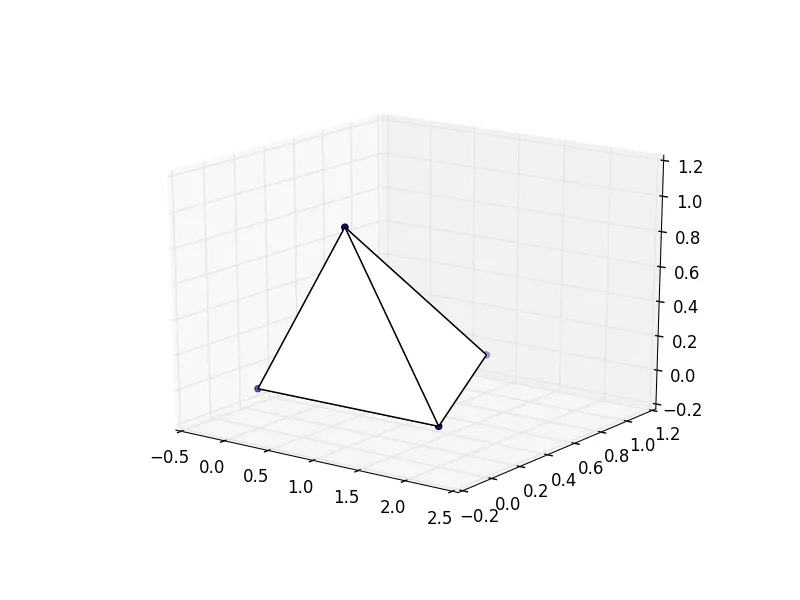
我正试图使用Python的Matplotlib库绘制一些对象。这些对象由使用plt.scatter()实现的点和使用Poly3DCollection实现的补丁组成。我希望补丁具有轻微透明度,以便可以看到补丁后面的点和边缘。

这是我已经生成的代码和绘图。似乎我已经接近成功,只是缺少透明度的功能。有没有人能为我提供建议?

enter image description here

from matplotlib import pyplot as plt
from mpl_toolkits.mplot3d.art3d import Poly3DCollection

fig = plt.figure()
ax = fig.add_subplot(111, projection='3d')

x = [0, 2, 1, 1]
y = [0, 0, 1, 0]
z = [0, 0, 0, 1]

vertices = [[0, 1, 2], [0, 1, 3], [0, 2, 3], [1, 2, 3]]

tupleList = list(zip(x, y, z))

poly3d = [[tupleList[vertices[ix][iy]] for iy in range(len(vertices[0]))] for ix in range(len(vertices))]
ax.scatter(x,y,z)
ax.add_collection3d(Poly3DCollection(poly3d, facecolors='w', linewidths=1, alpha=0.5))

plt.show()
5个回答

16

我对原始代码进行了轻微修改,并成功实现了透明效果。看起来,Poly3DCollection的facecolors参数会覆盖透明度参数,因此解决方案是在单独的调用中设置颜色,可以使用Poly3DCollection.set_colorPoly3DCollection.set_facecolor

from matplotlib import pyplot as plt
from mpl_toolkits.mplot3d.art3d import Poly3DCollection

fig = plt.figure()
ax = fig.add_subplot(111, projection='3d')

x = [0, 2, 1, 1]
y = [0, 0, 1, 0]
z = [0, 0, 0, 1]

vertices = [[0, 1, 2], [0, 1, 3], [0, 2, 3], [1, 2, 3]]

tupleList = zip(x, y, z)

poly3d = [[tupleList[vertices[ix][iy]] for iy in range(len(vertices[0]))] for ix in range(len(vertices))]
ax.scatter(x,y,z)
collection = Poly3DCollection(poly3d, linewidths=1, alpha=0.2)
face_color = [0.5, 0.5, 1] # alternative: matplotlib.colors.rgb2hex([0.5, 0.5, 1])
collection.set_facecolor(face_color)
ax.add_collection3d(collection)

plt.show()

有趣的是,如果您使用collection.set_edgecolor('k')明确设置边缘颜色,则边缘也将遵守透明度设置。


13

我找到了一个不错的解决方法:在绘制数据后,再以相同颜色和较浅的线型重叠绘制另一个图。我使用Line3DCollection而不是 Poly3DCollection,因此不会绘制面部。结果看起来非常符合预期。

请参见下面的新图和创建它的脚本。

enter image description here

from matplotlib import pyplot as plt
from mpl_toolkits.mplot3d.art3d import Poly3DCollection, Line3DCollection

fig = plt.figure()
ax = fig.add_subplot(111, projection='3d')

x = [0, 2, 1, 1]
y = [0, 0, 1, 0]
z = [0, 0, 0, 1]

vertices = [[0, 1, 2], [0, 1, 3], [0, 2, 3], [1, 2, 3]]

tupleList = list(zip(x, y, z))

poly3d = [[tupleList[vertices[ix][iy]] for iy in range(len(vertices[0]))] for ix in range(len(vertices))]
ax.scatter(x,y,z)
ax.add_collection3d(Poly3DCollection(poly3d, facecolors='w', linewidths=1, alpha=0.5))
ax.add_collection3d(Line3DCollection(poly3d, colors='k', linewidths=0.2, linestyles=':'))

plt.show()

1
通常情况下,
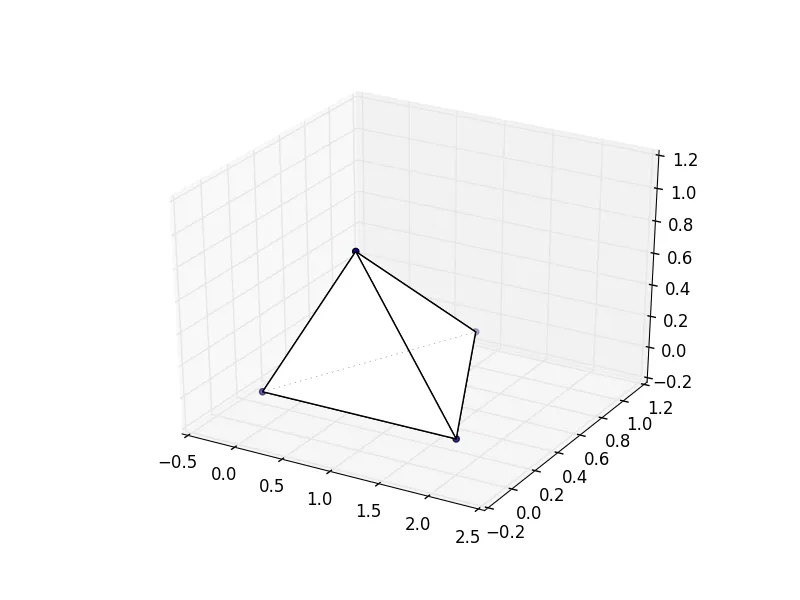
Line3DCollection的补丁必须是封闭的(不像Poly3DCollection那样)。在这个例子中并不重要,但通常我们应该以第一个顶点的重复结束,即vertices = [[0, 1, 2], [0, 1, 3], [0, 2, 3], [1, 2, 3], [0, 1, 2]] - Chilichiller
为了后代,xyz是对vertices的索引。这有点令人困惑,因为它们都恰好是小正整数。Poly3DCollection的参数是[[v1, v2, v3], [v2, v3, v4], [v3, v4, v5]],其中v1是一个包含x、y、z位置值的元组。 - Cuadue

4
非常感谢Chilichiller和Julian的帮助。你们的例子对我目前正在进行的一个关于使用matplotlib进行矩阵3D表示的小项目非常有用,Poly3DCollection似乎很适合这个任务。
需要注意的是,在Python 3中运行您的示例会导致TypeError:'zip' object is not subscriptable。
最简单的解决方法是将zip的返回值包装在list()的调用中(正如“Dive Into Python 3”所指出的:http://www.diveintopython3.net/porting-code-to-python-3-with-2to3.html)。

很高兴能对您有所帮助。我现在在原始片段中添加了list()命令,使示例代码与Python3兼容。 - Chilichiller

4

这是使用仅一次Poly3DCollection调用的版本,其中edgecolors='k'控制线条的颜色,facecolors='w'控制面的颜色。请注意,Matplotlib为多边形后面的边缘着色为浅灰色。

enter image description here

from matplotlib import pyplot as plt
from mpl_toolkits.mplot3d.art3d import Poly3DCollection, Line3DCollection

fig = plt.figure()
ax = fig.add_subplot(111, projection='3d')

x = [0, 2, 1, 1]
y = [0, 0, 1, 0]
z = [0, 0, 0, 1]

vertices = [[0, 1, 2], [0, 1, 3], [0, 2, 3], [1, 2, 3]]

tupleList = list(zip(x, y, z))

poly3d = [[tupleList[vertices[ix][iy]] for iy in range(len(vertices[0]))] for ix in range(len(vertices))]
ax.scatter(x,y,z)
ax.add_collection3d(Poly3DCollection(poly3d, edgecolors='k', facecolors='w', linewidths=1, alpha=0.5))

plt.show()

注意Poly3DCollection 的 API 相当混乱:接受的关键字参数都是 colorsedgecoloredgecolorsfacecolorfacecolors。使用别名和装饰器来定义多个 kwargs 意味着相同的东西,在 facecoloredgecolor 中可选使用 "s"。


如果您能够为colorsedgecolor等文档添加超链接,那将会很有帮助。 - Nagabhushan S N

2

这个问题已经在新的matplotlib中得到了解决。我正在运行1.5.1版本。

您可以通过运行python,然后执行以下操作来查看您的版本:

import matplotlib
matplotlib.__version__

您可以使用pip获取matplotlib。如果您正在使用Ubuntu,请在终端中运行以下命令:
sudo apt-get install python-pip
sudo pip install matplotlib

网页内容由stack overflow 提供, 点击上面的
可以查看英文原文,
原文链接