我正在绘制一些数据,并在x轴和y轴上得到峰值。我想用多种颜色突出显示峰值的某些区域。
我已经能够得到图形,但不知道如何添加叠加层到图形中。
https://jascoinc.com/wp-content/uploads/2013/12/UV-fraction-collection.png
最初的回答:
我正在绘制一些数据,并在x轴和y轴上得到峰值。我想用多种颜色突出显示峰值的某些区域。
我已经能够得到图形,但不知道如何添加叠加层到图形中。
https://jascoinc.com/wp-content/uploads/2013/12/UV-fraction-collection.png
最初的回答:
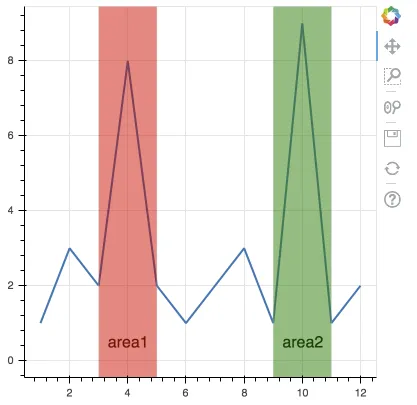
BoxAnnotation来实现这一点。其中一个优点是它始终跨越整个绘图的高度。from bokeh.plotting import figure, show
from bokeh.models import BoxAnnotation
p = figure(plot_width=400, plot_height=400)
p.line([1, 2, 3, 4, 5, 6, 7, 8, 9, 10, 11, 12], [1, 3, 2, 8, 2, 1, 2, 3, 1, 9, 1, 2], line_width=2)
b1 = BoxAnnotation(left=3, right = 5, fill_color = 'red', fill_alpha = 0.5)
b2 = BoxAnnotation(left=9, right = 11, fill_color = 'green', fill_alpha = 0.5)
p.add_layout(b1)
p.add_layout(b2)
p.text([4, 10], [0, 0], ['area1', 'area2'], y_offset = -10, x_offset = -20)
show(p)
from bokeh.plotting import figure, show

p = figure(plot_width=400, plot_height=400)

p.line([1, 2, 3, 4, 5, 6, 7, 8, 9, 10, 11, 12], [1, 3, 2, 8, 2, 1, 2, 3, 1, 9, 1, 2], line_width=2)
p.vbar(x=[4, 10], width=2, bottom=0, top=10, color=['red', 'green'], alpha=0.5)

show(p)
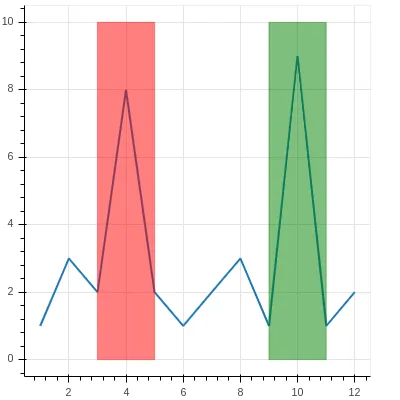
width=2替换为width=[2, 4]来为每个垂直条使用不同的宽度。如果你想要使用固定位置,你必须使用矩形。详见:https://bokeh.pydata.org/en/latest/docs/user_guide/plotting.html#rectangles - Jasper