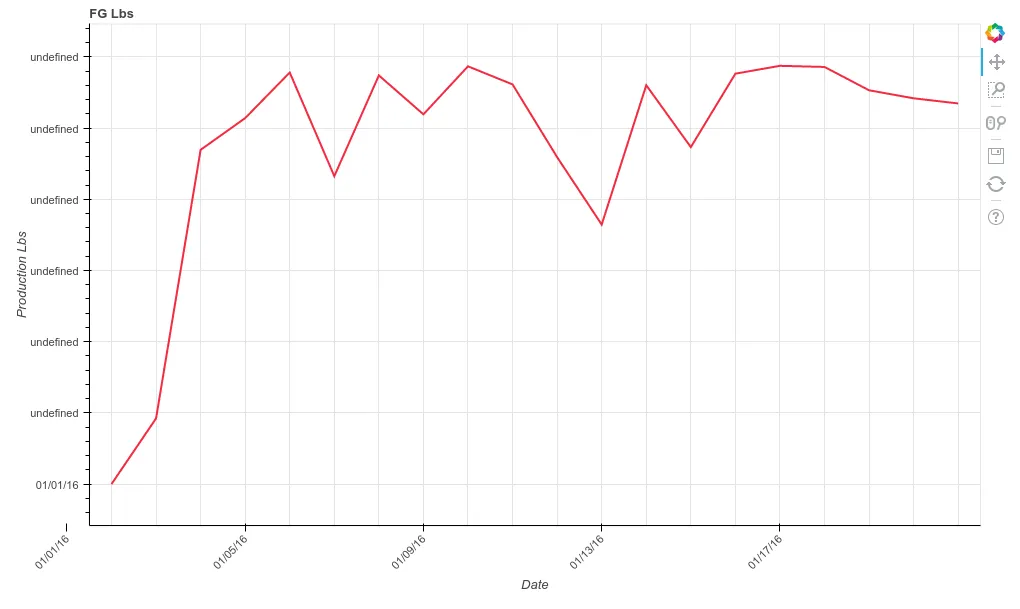
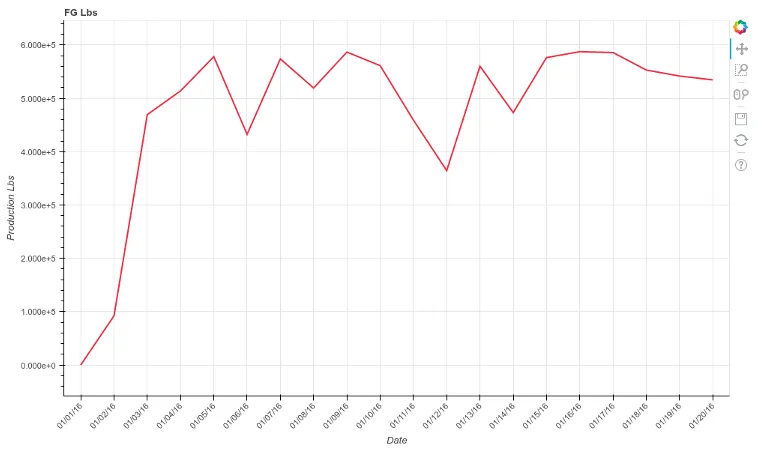
Bokeh:选择要在图中显示的x轴(不是数字)

6

我有一个像这样的情节:

from bokeh.io import output_file, show
from bokeh.charts import Line
from bokeh.models import FixedTicker
import pandas as pd

output_file('file.html')
data = {'Date shift end': {0: '01/01/16', 1: '01/02/16', 2: '01/03/16',
                           3: '01/04/16', 4: '01/05/16', 5: '01/06/16',
                           6: '01/07/16', 7: '01/08/16', 8: '01/09/16',
                           9: '01/10/16', 10: '01/11/16', 11: '01/12/16',
                           12: '01/13/16', 13: '01/14/16', 14: '01/15/16',
                           15: '01/16/16', 16: '01/17/16', 17: '01/18/16',
                           18: '01/19/16', 19: '01/20/16'},
        'Finance_Lbs': {0: 0.0, 1: 92218.080000000002, 2: 469434.14000000001,
                        3: 513948.95000000001, 4: 578014.71999999997,
                        5: 432396.69, 6: 573912.75,
                        7: 519266.57000000001, 8: 586680.66000000003,
                        9: 561292.56999999995, 10: 459121.15000000002,
                        11: 364463.34999999998, 12: 560154.51000000001,
                        13: 473212.65999999997, 14: 576373.17000000004,
                        15: 587393.56999999995, 16: 585796.46999999997,
                        17: 553028.40000000002, 18: 541770.03000000003,
                        19: 534533.95999999996}}
data = pd.DataFrame(data)
plot = Line(data, 'Date shift end', 'Finance_Lbs', title='FG Lbs',
            xlabel='Date', ylabel='Production Lbs', width=1000)
show(plot) 

enter image description here

我希望显示这个图,包括所有点,但只在x轴上显示特定的刻度。
['01/01/16', '01/05/16', '01/10/16', '01/15/16', '01/20/16']

使用FixedTicker时,我得到了这个错误:
>>> plot.xaxis[0].ticker=FixedTicker(ticks=['01/01/16', '01/05/16',
                                            '01/10/16', '01/15/16'])
Error: expected an element of Seq(Float), got seq with invalid items
>>>

我只能使用整数作为ticks参数:

>>> plot.xaxis[0].ticker=FixedTicker(ticks=[0, 5, 10, 15])

但是我拥有数字而不是以字符串格式表示的“日期”。

1
使用类似于这里的FixedTicker之后的p.xaxis.formatter(http://stackoverflow.com/questions/40453228/can-i-change-tickers-in-a-plot-to-custom-text-tickers/40469619#40469619)可以让您放置所需的文本。 - user3313834
1个回答

0
from bokeh.io import output_file, show
from bokeh.charts import Line
from bokeh.models import FixedTicker
from bokeh.models import FuncTickFormatter, FixedTicker
import json
import pandas as pd

output_file('file.html')
data = {'Date shift end': {0: '01/01/16', 1: '01/02/16', 2: '01/03/16',
                           3: '01/04/16', 4: '01/05/16', 5: '01/06/16',
                           6: '01/07/16', 7: '01/08/16', 8: '01/09/16',
                           9: '01/10/16', 10: '01/11/16', 11: '01/12/16',
                           12: '01/13/16', 13: '01/14/16', 14: '01/15/16',
                           15: '01/16/16', 16: '01/17/16', 17: '01/18/16',
                           18: '01/19/16', 19: '01/20/16'},
        'Finance_Lbs': {0: 0.0, 1: 92218.080000000002, 2: 469434.14000000001,
                        3: 513948.95000000001, 4: 578014.71999999997,
                        5: 432396.69, 6: 573912.75,
                        7: 519266.57000000001, 8: 586680.66000000003,
                        9: 561292.56999999995, 10: 459121.15000000002,
                        11: 364463.34999999998, 12: 560154.51000000001,
                        13: 473212.65999999997, 14: 576373.17000000004,
                        15: 587393.56999999995, 16: 585796.46999999997,
                        17: 553028.40000000002, [![enter image description here][1]][1]18: 541770.03000000003,
                        19: 534533.95999999996}}
data = pd.DataFrame(data)
dicaxis = data['Date shift end'].to_dict()
paxis = len(data)/5
select_axis_key = range(0, len(data), paxis)
select_axis = {k:v for (k,v) in dicaxis.items() if k in select_axis_key}

plot = Line(data, 'Date shift end', 'Finance_Lbs', title='FG Lbs',
            xlabel='Date', ylabel='Production Lbs', width=1000)
mapp = """ var mapping = {};
       return mapping[tick]; """
plot.xaxis.ticker = FixedTicker(ticks=select_axis_key)
plot.axis.formatter = FuncTickFormatter(code=mapp.format(json.dumps(select_axis)))
show(plot)

Bokeh Plot


网页内容由stack overflow 提供, 点击上面的
可以查看英文原文,
原文链接