使用Cartopy添加网格线

6

我想在使用Cartopy制作的地图中添加网格线,然而,当我使用Cartopy文档中的示例代码时,它并没有显示我想要的结果,我无法弄清楚如何操作它以达到预期效果。

def plotMap():

    proj = ccrs.Mercator(central_longitude=180, min_latitude=15, 
    max_latitude=55)

    fig, ax = plt.subplots(subplot_kw=dict(projection=proj), figsize=(12,12))

    ax.set_extent([255 ,115, 0, 60], crs=ccrs.PlateCarree())

    ax.add_feature(cfeature.LAND, facecolor='0.3')
    ax.add_feature(cfeature.LAKES, alpha=0.9)  
    ax.add_feature(cfeature.BORDERS, zorder=10)
    ax.add_feature(cfeature.COASTLINE, zorder=10)


    #(http://www.naturalearthdata.com/features/)
    states_provinces = cfeature.NaturalEarthFeature(
            category='cultural',  name='admin_1_states_provinces_lines',
            scale='50m', facecolor='none')
    ax.add_feature(states_provinces, edgecolor='black', zorder=10)

    #ax.gridlines(xlocs=grids_ma, ylocs=np.arange(-80,90,20), zorder=21, 
    draw_labels=True ) 
    ax.gridlines(crs=ccrs.PlateCarree(), linewidth=2, color='black', 
    draw_labels=True, alpha=0.5, linestyle='--')
    ax.xlabels_top = False
    ax.ylabels_left = False
    ax.ylabels_right=True
    ax.xlines = True
    ax.xlocator = mticker.FixedLocator([-160, -140, -120, 120, 140, 160, 180,])
    ax.xformatter = LONGITUDE_FORMATTER
    ax.yformatter = LATITUDE_FORMATTER
    ax.xlabel_style = {'size': 15, 'color': 'gray'}
    ax.xlabel_style = {'color': 'red', 'weight': 'bold'}


    return fig, ax

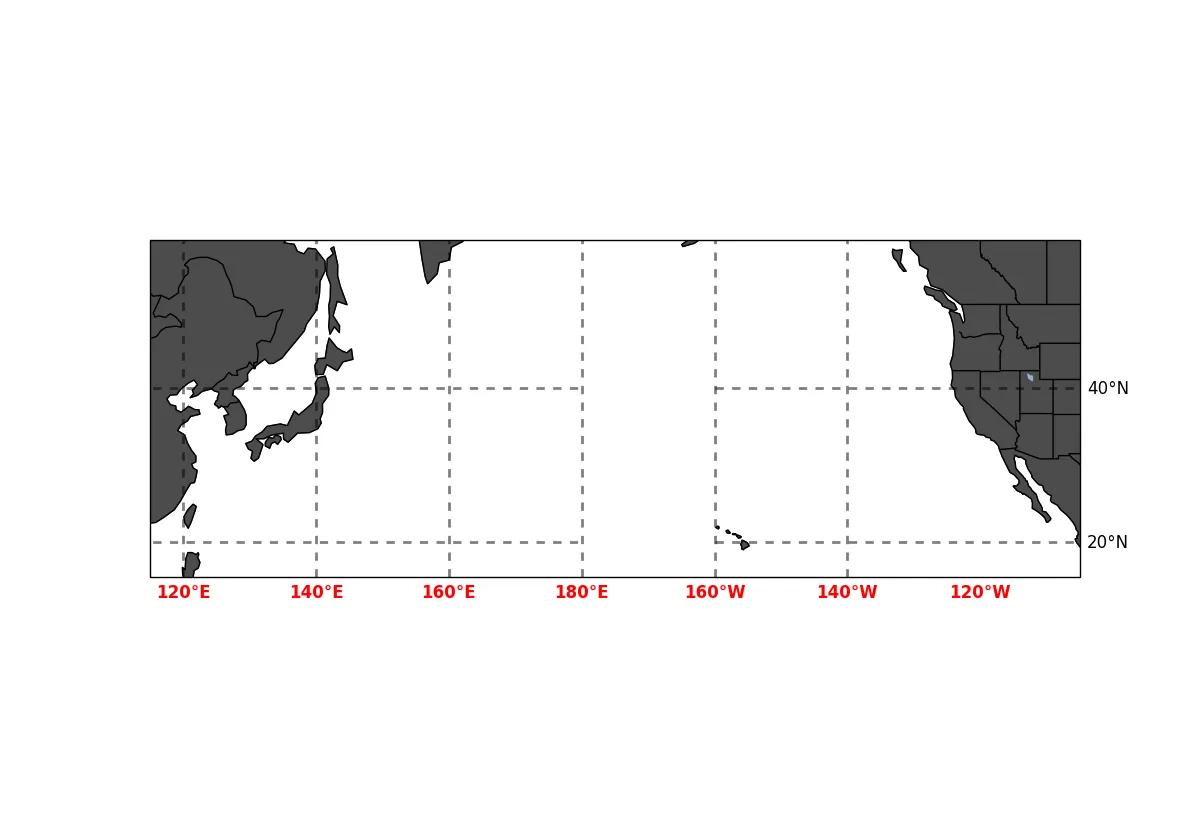
我已经附上了输出的图片。参考一下,我只想要经度网格线从我的区域左侧开始,到右侧结束,最好每20度间隔一次。理想情况下,纬度线也是如此。 错误的网格线绘图
1个回答

12
更新:Cartopy的网格线问题如下所述已经修复,因此下面的任何一种代码解决方案现在都应该能够得到所需的结果。
你所遵循的示例是在此页面底部的那个吗?如果是的话,你正在尝试在GeoAxes(ax)实例上设置属性,而应该在GridLiner(gl)实例上设置:
import cartopy
import cartopy.crs as ccrs
import cartopy.feature as cfeature
import matplotlib.pyplot as plt
import matplotlib.ticker as mticker

from cartopy.mpl.gridliner import LONGITUDE_FORMATTER, LATITUDE_FORMATTER

def plotMap():    
    proj = ccrs.Mercator(central_longitude=180, min_latitude=15, 
    max_latitude=55)

    fig, ax = plt.subplots(subplot_kw=dict(projection=proj), figsize=(12,12))

    ax.set_extent([255 ,115, 0, 60], crs=ccrs.PlateCarree())

    ax.add_feature(cfeature.LAND, facecolor='0.3')
    ax.add_feature(cfeature.LAKES, alpha=0.9)  
    ax.add_feature(cfeature.BORDERS, zorder=10)
    ax.add_feature(cfeature.COASTLINE, zorder=10)

    states_provinces = cfeature.NaturalEarthFeature(
            category='cultural',  name='admin_1_states_provinces_lines',
            scale='50m', facecolor='none')
    ax.add_feature(states_provinces, edgecolor='black', zorder=10)   
    
    gl = ax.gridlines(crs=ccrs.PlateCarree(), linewidth=2, color='black', alpha=0.5, linestyle='--', draw_labels=True)
    gl.xlabels_top = False
    gl.ylabels_left = False
    gl.ylabels_right=True
    gl.xlines = True
    gl.xlocator = mticker.FixedLocator([120, 140, 160, 180, -160, -140, -120])
    gl.ylocator = mticker.FixedLocator([0, 20, 40, 60])
    gl.xformatter = LONGITUDE_FORMATTER
    gl.yformatter = LATITUDE_FORMATTER
    gl.xlabel_style = {'color': 'red', 'weight': 'bold'}

这会产生以下地图。网格线似乎无法处理日期线。我不知道是否有解决办法,但上述链接文档的顶部有一条注释,说明这个类目前存在已知的限制,所以可能没有解决办法。

enter image description here

另一种方法是直接使用matplotlib来设置各种标签及其样式。请注意,您必须将刻度标签与刻度分开设置,否则会得到与Mercator坐标参考系统相对应的标签。
import cartopy.mpl.ticker as cticker

def plotMap2():
    proj = ccrs.Mercator(central_longitude=180, min_latitude=15, 
    max_latitude=55)

    fig, ax = plt.subplots(subplot_kw=dict(projection=proj), figsize=(12,12))

    ax.set_extent([255 ,115, 0, 60], crs=ccrs.PlateCarree())

    ax.add_feature(cfeature.LAND, facecolor='0.3')
    ax.add_feature(cfeature.LAKES, alpha=0.9)  
    ax.add_feature(cfeature.BORDERS, zorder=10)
    ax.add_feature(cfeature.COASTLINE, zorder=10)

    states_provinces = cfeature.NaturalEarthFeature(
            category='cultural',  name='admin_1_states_provinces_lines',
            scale='50m', facecolor='none')
    ax.add_feature(states_provinces, edgecolor='black', zorder=10)

    ax.set_xticks([120., 140., 160., 180., -160., -140., -120.], crs=ccrs.PlateCarree())
    ax.set_xticklabels([120., 140., 160., 180., -160., -140., -120.], color='red', weight='bold')
    ax.set_yticks([20, 40], crs=ccrs.PlateCarree())
    ax.set_yticklabels([20, 40])
    ax.yaxis.tick_right()
    
    lon_formatter = cticker.LongitudeFormatter()
    lat_formatter = cticker.LatitudeFormatter()
    ax.xaxis.set_major_formatter(lon_formatter)
    ax.yaxis.set_major_formatter(lat_formatter)
    ax.grid(linewidth=2, color='black', alpha=0.5, linestyle='--')

enter image description here


哇,这太棒了!这正是我想要的。非常感谢。 - Eli Turasky

网页内容由stack overflow 提供, 点击上面的
可以查看英文原文,
原文链接