使用Python的PIL,有没有好的颜色映射可以将灰度图像转换为彩色图像?

18

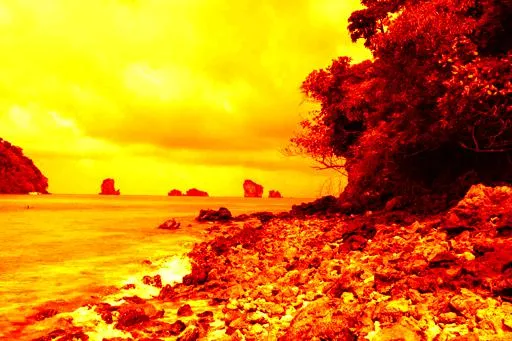
Matplotlib有很多好的配色方案,但性能不佳。我正在编写一些代码,将灰度图像变为彩色,使用配色方案进行插值是一个好主意。我想知道是否有开源的配色方案可用或演示代码可以使用Pillow将灰度图像转换为彩色图像?


说明:

  1. Matplotlib适合演示,但对于成千上万张图片的性能不佳。
  2. Matplotlib配色方案
  3. 您可以将灰度图像映射到配色方案以获得彩色图像。
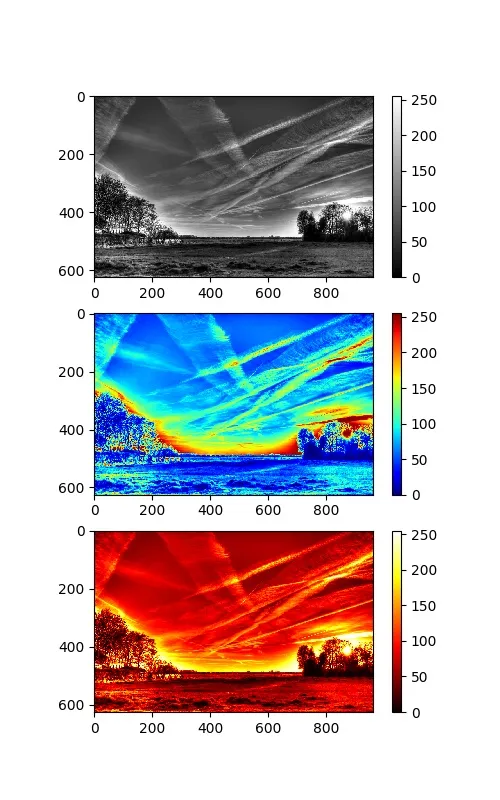
演示:

第一张图片是灰度图像,第二张使用'jet'配色方案映射,第三张使用'hot'配色方案。

Matplotlib demo

问题在于,我对颜色不太了解,并且我希望在PIL中实现这样的效果,以获得更好的性能。


请澄清你的问题,“但性能不佳”是什么原因?“使用颜色映射进行插值是个好主意”,你是什么意思?“将灰度图像转换为彩色图像”,以何种方式?哪些颜色应映射到哪些灰度色调?你有输入图像和结果的示例吗? - Bart
2个回答

24

您可以使用matplotlib中的颜色映射,并在没有任何matplotlib图形的情况下应用它们等。这将使事情更加快速:

import matplotlib.pyplot as plt

# Get the color map by name:
cm = plt.get_cmap('gist_rainbow')

# Apply the colormap like a function to any array:
colored_image = cm(image)

# Obtain a 4-channel image (R,G,B,A) in float [0, 1]
# But we want to convert to RGB in uint8 and save it:
Image.fromarray((colored_image[:, :, :3] * 255).astype(np.uint8)).save('test.png')

注意:

  • 如果您的输入图像是浮点数,则值应在区间[0.0, 1.0]内。
  • 如果您的输入图像是整数,则整数应在范围[0,N)内,其中N是映射中的颜色数。但根据您的需求,您可以重新采样映射为任意数量的值:

  • # If you need 8 color steps for an integer image with values from 0 to 7:
    cm = plt.get_cmap('gist_rainbow', lut=8)
    

16

我通过@ImportanceOfBeingErnest提到的重复答案找到了解决方案 (如何将Numpy数组转换为PIL图像并应用matplotlib颜色映射)

import matplotlib as mpl
import matplotlib.pyplot as plt
import matplotlib.image as mpimg
import numpy as np

import timeit

from PIL import Image

def pil_test():
    cm_hot = mpl.cm.get_cmap('hot')
    img_src = Image.open('test.jpg').convert('L')
    img_src.thumbnail((512,512))
    im = np.array(img_src)
    im = cm_hot(im)
    im = np.uint8(im * 255)
    im = Image.fromarray(im)
    im.save('test_hot.jpg')

def rgb2gray(rgb):
    return np.dot(rgb[:,:,:3], [0.299, 0.587, 0.114])

def plt_test():
    img_src = mpimg.imread('test.jpg')
    im = rgb2gray(img_src)
    f = plt.figure(figsize=(4, 4), dpi=128)
    plt.axis('off')
    plt.imshow(im, cmap='hot')
    plt.savefig('test2_hot.jpg', dpi=f.dpi)
    plt.close()

t = timeit.timeit(pil_test, number=30)
print('PIL: %s' % t)
t = timeit.timeit(plt_test, number=30)
print('PLT: %s' % t)

性能测试结果如下:
PIL: 1.7473899199976586
PLT: 10.632971412000188

它们都使用 hot 颜色映射,给我类似的结果。

使用 hot 颜色映射的测试图像


虽然它不能完全消除时间差异,但你肯定应该将matplotlib后端切换为非交互式的。你想要PNG格式,所以使用mpl.use("agg")。通过你的代码测试,速度大约快了两倍。 - NichtJens

网页内容由stack overflow 提供, 点击上面的
可以查看英文原文,
原文链接