import networkx as nx
%matplotlib inline
import matplotlib.pyplot as plt
G2=nx.DiGraph()
G2.add_node(900,pos=(0,0))
G2.add_node(901,pos=(1,0))
G2.add_node(902,pos=(0,1))
G2.add_node(903,pos=(1,1))
G2.add_node(904,pos=(0,-1))
nodePos = nx.circular_layout(G2)
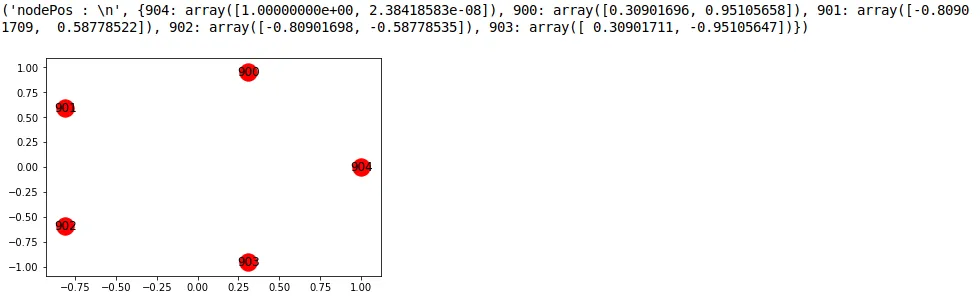
print("nodePos : \n" , nodePos)
nx.draw_networkx(G2, with_labels = True)
plt.show()
上面的代码创建了下图所示的图形,并给出节点位置:
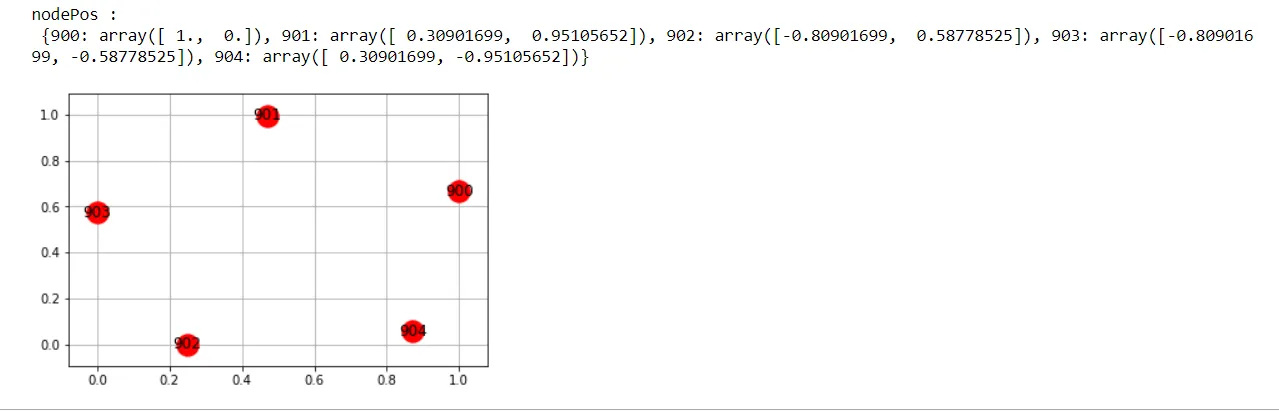
nodePos:
{900:array([1.,0.]),901:array([0.30901699,0.95105652]),902:array([-0.80901699,0.58778525]),903:array([-0.80901699,-0.58778525]),904:array([0.30901699,-0.95105652])}
问题:
a)节点900被赋予位置0,0,但是x似乎大于0.8...同样,节点904的y被给定为-1,但是坐标系中没有显示-1。
b)nx.circular_layout()应该返回节点的位置,这就是我在nodePos中打印的内容。但是,我不理解在nodePos中打印的值。为什么我看到带有负值的小数值。
c)我的意图是获取节点的正确位置,以便我可以在Qt/Java等中进行图形绘制...