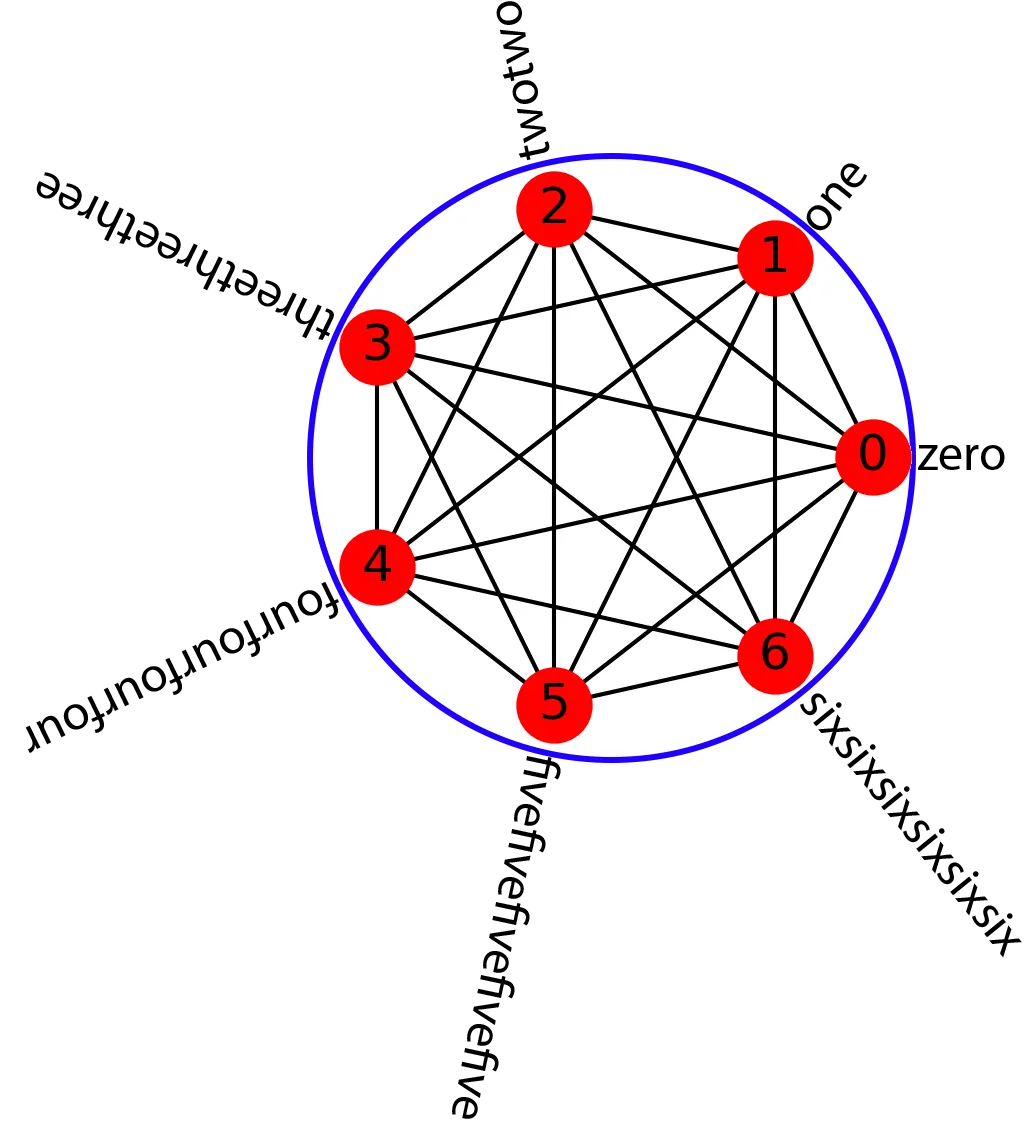
我正在处理以下问题。我想绘制一个包括大约100个节点的圆形图,必须手动对它们进行分类,并根据先前的分类进行定位。这些节点有一个分配的标签,用于描述它们,具有不同的文本长度,并且我想将此标签放置在节点旁边。下面是我想要获得的图(我只画了蓝色圆圈,以显示标签在周边完美对齐):
https://istack.dev59.com/Qre0Z.webp
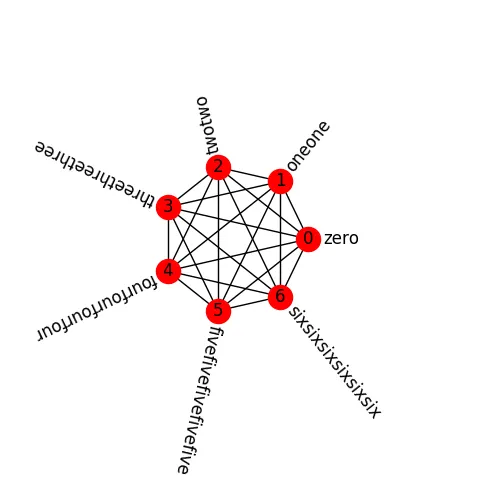
到目前为止,我只能画出以下内容:https://istack.dev59.com/U7bZG.webp
以下是MWE:
我想我得添加并调整一下。
在设置标签旋转的循环中,我不知道如何正确设置,并且也不知道如何避免裁剪画布。
import numpy as np
import networkx as nx
import matplotlib.pyplot as plt

n = 7
G = nx.complete_graph(n)
node_list = sorted(G.nodes())
angle = []
angle_dict = {}
for i, node in zip(xrange(n),node_list):
    theta = 2.0*np.pi*i/n
    angle.append((np.cos(theta),np.sin(theta)))
    angle_dict[node] = theta
pos = {}
for node_i, node in enumerate(node_list):
    pos[node] = angle[node_i]

labels = {0:'zero',1:'oneone',2:'twotwo',3:'threethreethree',4:'fourfourfourfour',5:'fivefivefivefivefive',6:'sixsixsixsixsixsix'}

# figsize is intentionally set small to condense the graph
f = plt.figure(figsize=(2,2))
r = f.canvas.get_renderer()
plt.axis('equal')
nx.draw(G,pos=pos,with_labels=True)
description = nx.draw_networkx_labels(G,pos,labels=labels)
for node, t in description.items():
    t.set_rotation(angle_dict[node]*360.0/(2.0*np.pi))
plt.show()
我想我得添加并调整一下。
x, y = t.get_position()
bb = t.get_window_extent(renderer=r)
radius = 1.0+2.0*bb.width/r.width
t.set_position((radius*x,radius*y))
在设置标签旋转的循环中,我不知道如何正确设置,并且也不知道如何避免裁剪画布。
n = 10,那么标记将是 _(zero, one, twotwo, ... , nineninenineninenineninenineninenine)_,并且使用plt.savefig保存图像时,保存的图像会被裁剪。在代码中应添加什么以避免裁剪? - adriaatfigsize=(5,5)和边距之间的相互作用。使用bbox_inches = "tight"参数,图形大小也可以自动缩放为保存的图形。你还可以减小字体大小。这完全取决于你的目标是什么。 - ImportanceOfBeingErnest