如何调整图片的尺寸以适合打印呢?
举个例子,我想使用A4纸,它的尺寸是11.7英寸乘以8.27英寸,横向排列。
举个例子,我想使用A4纸,它的尺寸是11.7英寸乘以8.27英寸,横向排列。
# Sets the figure size temporarily but has to be set again the next plot
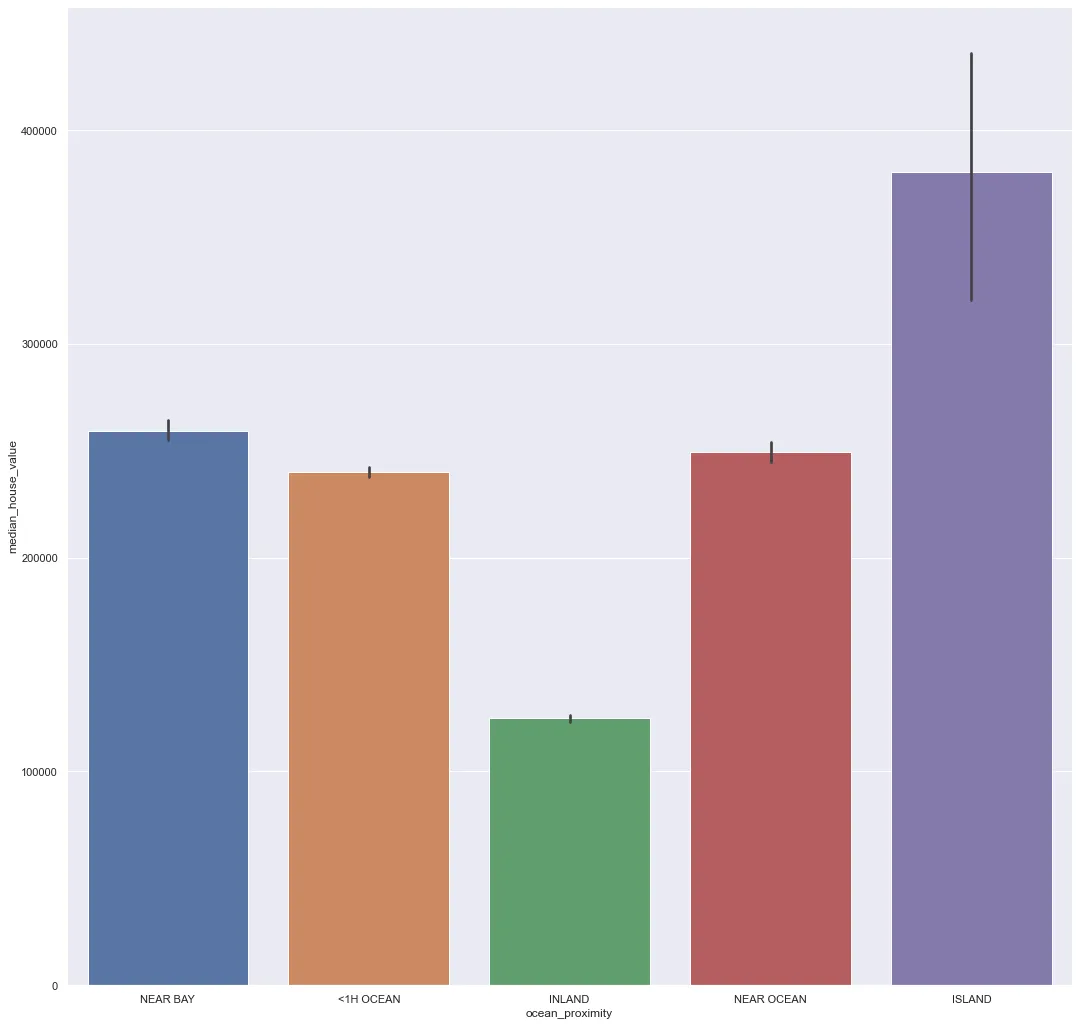
plt.figure(figsize=(18,18))
sns.barplot(x=housing.ocean_proximity, y=housing.median_house_value)
plt.show()
一些尝试过的方法:
import seaborn as sns
import matplotlib.pyplot as plt
fig, ax = plt.subplots(figsize=[15,7])
sns.boxplot(x="feature1", y="feature2",data=df, ax=ax) # where df would be your dataframe
或者
import seaborn as sns
import matplotlib.pyplot as plt
plt.figure(figsize=[15,7])
sns.boxplot(x="feature1", y="feature2",data=df) # where df would be your dataframe
Seaborn具有返回Axes对象的绘图函数。可以使用set()或set_theme()函数(如niraj的答案中所示)全局更改这些绘图的大小。
import seaborn as sns
df = sns.load_dataset("tips")

sns.set_theme(rc={'figure.figsize': (8.27, 11.7)})
ax = sns.regplot(df, x='total_bill', y='tip')
set_size_inches()。请注意,dmainz's answer的答案也可以实现类似的效果,但是它是通过分别设置宽度和高度来实现的;而这种方法可以在一个函数调用中同时设置它们。如果你的seaborn图表是在其他地方创建的,并且你想要将其大小更改为你想要的英寸大小,这将非常有用。ax = sns.regplot(df, x='total_bill', y='tip') # the default figsize is 6.4"x4.8"
ax.figure.set_size_inches(8.27, 11.7) # now it becomes 8.27"x11.7"
plt.gcf()来进行更改。例如:import matplotlib.pyplot as plt
sns.regplot(df, x='total_bill', y='tip')
plt.gcf().set_size_inches(8.27, 11.7)
set()或set_theme()会全局改变图形的大小,这可能不是您所期望的,如果您只想设置单个图形的特定大小并对其他图形使用默认设置。在这种情况下,您可以使用上下文管理器来更改单个图形的大小。with plt.rc_context(rc={'figure.figsize': (8.27, 11.7)}):
sns.regplot(df, x='total_bill', y='tip')
与上述更改底层 matplotlib 图形大小类似,对于 FacetGrid 对象也可以进行相同的操作。以下是一个示例:
g = sns.lmplot(data=df, x='total_bill', y='tip')  # the default figsize is 5"x5"
g.fig.set_size_inches(8.27, 11.7)                 # now it becomes 8.27"x11.7"
plt.gcf() 来进行更改。sns.lmplot(data=df, x='total_bill', y='tip')
plt.gcf().set_size_inches(8.27, 11.7)
plt.figure(figsize=(X,Y))在Jupyter扩展中的VS Code和seaborn 0.12.2中没有任何作用。 - sharchaeaplt.figure(figsize=(X,Y))在VS Code的Jupyter扩展和seaborn 0.12.2中似乎没有任何作用。 - undefined