如何调整图片的尺寸以适合打印呢?
举个例子,我想使用A4纸,它的尺寸是11.7英寸乘以8.27英寸,横向排列。
举个例子,我想使用A4纸,它的尺寸是11.7英寸乘以8.27英寸,横向排列。
import seaborn as sns

sns.set(rc={'figure.figsize':(11.7,8.27)})
另一种选择是使用rcParams的figure.figsize来设置图形大小,如下所示:
from matplotlib import rcParams

# figure size in inches
rcParams['figure.figsize'] = 11.7,8.27
更多细节可以在Matplotlib文档中找到。
您需要提前创建Matplotlib的Figure和Axes对象,指定图形的大小:
from matplotlib import pyplot
import seaborn

import mylib

a4_dims = (11.7, 8.27)
df = mylib.load_data()
fig, ax = pyplot.subplots(figsize=a4_dims)
seaborn.violinplot(ax=ax, data=df, **violin_options)
fig,ax = pyplot.subplots(figsize =(12,6)); sns.jointplot(memoryPrice ['price'],memoryPrice ['Memory'])。 - TMWPsns.lmplot()。 - F.S.height 和 aspect 参数来设置绘图大小,具体请参考 https://dev59.com/tlwZ5IYBdhLWcg3wVO5U#51602446。 - LeandroOrdonez请注意,如果您正在尝试传递给seaborn中的“图表级”方法(例如lmplot,catplot/factorplot,jointplot),则可以通过在参数中使用height和aspect指定此内容。
sns.catplot(data=df, x='xvar', y='yvar',
    hue='hue_bar', height=8.27, aspect=11.7/8.27)
有关图形级别方法不遵守轴规范的详细信息,请参见https://github.com/mwaskom/seaborn/issues/488和Plotting with seaborn using the matplotlib object-oriented interface。
relplot。即使使用plt.figure(figsize=...)提前创建图形,我仍然需要指定height/aspect来改变尺寸。我更喜欢这种方法而不是sns.set()的解决方案,因为我希望不同的图形有不同的值。 - Neil Traft首先导入matplotlib并使用它来设置图形的大小
from matplotlib import pyplot as plt
import seaborn as sns

plt.figure(figsize=(15,8))
ax = sns.barplot(x="Word", y="Frequency", data=boxdata)
你可以将上下文设置为poster,或者手动设置fig_size。
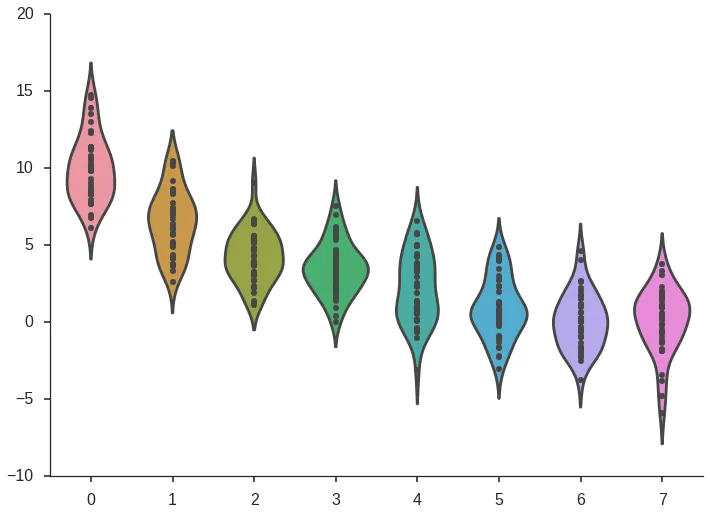
import numpy as np
import seaborn as sns
import matplotlib.pyplot as plt

np.random.seed(0)
n, p = 40, 8
d = np.random.normal(0, 2, (n, p))
d += np.log(np.arange(1, p + 1)) * -5 + 10


# plot
sns.set_style('ticks')
fig, ax = plt.subplots()
# the size of A4 paper
fig.set_size_inches(11.7, 8.27)
sns.violinplot(data=d, inner="points", ax=ax)
sns.despine()

fig.savefig('example.png')
sns.lmplot()。 - F.S.这可以通过以下方式完成:
plt.figure(figsize=(15,8))
sns.kdeplot(data,shade=True)
import matplotlib.pyplot as plt就可以使用这个简单的调用,那就太好了。我想知道为什么他们不直接使用sns.set_figure_size()来公开它。 - n1k31t4除了elz回答的关于返回多图网格对象的“图形级别”方法之外,还可以使用以下方法明确设置图形的高度和宽度(而不是使用纵横比):
import seaborn as sns

g = sns.catplot(data=df, x='xvar', y='yvar', hue='hue_bar')
g.fig.set_figwidth(8.27)
g.fig.set_figheight(11.7)
set_figwidth和set_figheight在网格对象中的使用效果很好。 - Paul Rougieux导入 seaborn 导入 matplotlib.pyplot as pyplot tips = seaborn.load_dataset("tips") g = seaborn.FacetGrid(tips, col="time", row="smoker") g = g.map(pyplot.hist, "total_bill") g.fig.set_figwidth(10) g.fig.set_figheight(10)
0.11.1 - 此页面上的其他解决方案均无效。 - joshi123这也应该可以运作。
from matplotlib import pyplot as plt
import seaborn as sns

plt.figure(figsize=(15,16))
sns.countplot(data=yourdata, ...)
对于我的绘图(一个sns factorplot),提供的答案效果不佳。
因此我使用了
plt.gcf().set_size_inches(11.7, 8.27)
在 seaborn 绘制图形后(因此不需要将 ax 传递给 seaborn 或更改 rc 设置)。
g = sns.FacetGrid(df.set_index('category'), col="id")

pyplot.gcf().set_size_inches(11.7, 8.27)

g.map(lambda data, color: data.plot.barh(color=color), "count")
- Nicolas78sns.FacetGrid会根据计算的值(由height和aspect设置)设置图形大小,直接在seaborn绘图后更改图形大小也将起作用。并且在更改图形大小之后可以进行其他细微调整。 - Yunting Zhaoseaborn v0.12中的新seaborn.objects接口解决问题,该接口与seaborn axes-level或figure-level绘图不同。seaborn.displot)还是axes-level绘图(例如seaborn.histplot)。此答案适用于任何figure或axes level绘图。
seaborn是matplotlib的高级API,因此seaborn可以与matplotlib方法一起使用python 3.8.12、matplotlib 3.4.3和seaborn 0.11.2中进行了测试import seaborn as sns
import matplotlib.pyplot as plt
# load data
df = sns.load_dataset('penguins')
sns.displotheight和/或aspect参数可以调整图形级别绘图的大小fig对象并使用.set_dpi()来设置图形的dpip = sns.displot(data=df, x='flipper_length_mm', stat='density', height=4, aspect=1.5)
p.fig.set_dpi(100)
p.fig.set_dpi(100)
p.fig.set_dpi(100)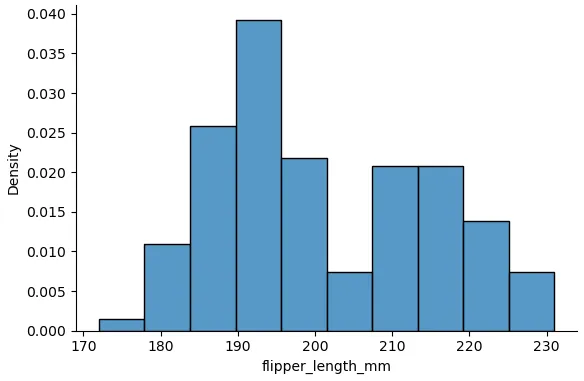
sns.histplotfigsize和/或dpi可以调整轴级绘图的大小。# create figure and axes
fig, ax = plt.subplots(figsize=(6, 5), dpi=100)
# plot to the existing fig, by using ax=ax
p = sns.histplot(data=df, x='flipper_length_mm', stat='density', ax=ax)
dpi=100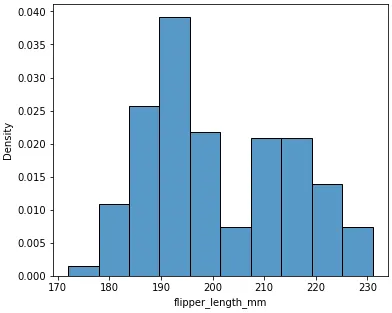
dpi=100
fig, ax = pyplot.subplots(figsize=(20, 2)); a = sns.lineplot(ax=ax, x=..., y=...)可以正常工作。当这样的参数,在seaborn里本应该很直接因为很常用,但需要使用一些“技巧”来设置时,我总是感到惊讶。 - Alex Poca