我正在尝试使用matplotlib在Jupyter Lab中对高斯调制波脉冲进行动画处理,但是我无法使其正常工作。我希望脉冲向前移动,即从中间向右移动(换句话说,显示脉冲传播)。
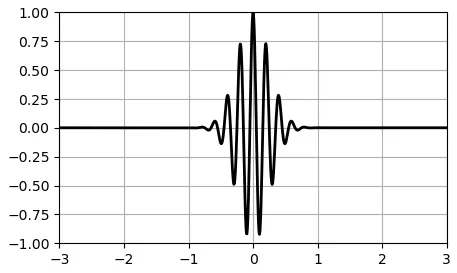
我通过使用scipy的“signal.gausspulse”函数创建脉冲本身,该函数创建脉冲的静态图像。然后,我创建了一个meshgrid,并尝试将脉冲映射到上面,同时通过循环遍历带有框架编号“i”的动画函数,该函数将值循环到我们要进行动画处理的值。
在我让脉冲在动画中移动之前,它只是静态的,没有任何运动。我想这是因为波脉冲的整个y-value数组没有随时间变化,所以我尝试为其创建一个更新循环。这有所帮助,但速度非常慢,并使脉冲向上移动两次,然后完全停止运动。
我无法解决这个问题,真的不知道该怎么做,所以任何帮助都将不胜感激! :) 我可能误用了某些术语,所以提前为此道歉-我尝试注释代码并解释我经过的步骤,希望能有所帮助。
%matplotlib widget

import numpy as np
from scipy import signal
import matplotlib.pyplot as plt
from matplotlib.animation import FuncAnimation

#setting up the canvas
fig, ax = plt.subplots(figsize=(5, 3))
ax.set(xlim=(-3, 3), ylim=(-1, 1))

#creating meshgrid for future animation
x = np.linspace(-10, 5, 200)
t = np.linspace(-10, 5, 200)
X2, T2 = np.meshgrid(x, t) #X2 and T2 are numpy arrays now

#creating the gaussian modulated pulse: fc is frequency and bw is another parameter than can be ignored
F = signal.gausspulse(X2, fc=5, bw = 0.3, retquad=False, retenv=True)[0]

#updating the values in F array to make the wave pulse move in time
j = 0
i = 0

for i in range(len(t)):
    for j in range(len(t)):
        F[i,j] += i - 5e-40 #some arbitrary value added/subtracted, chose e-40 bec of values in array F
        #F[i,j] += j + 5e-40

#creting a Line.2D to be plotted later; F vs time

line = ax.plot(t, F[0, :], color='k', lw=2)[0]

#animating function
def animate(i):
    return line.set_ydata(F[i,:])

anim = FuncAnimation(fig, animate,  interval=1000, frames=1000, repeat = False)

plt.draw()
plt.grid(True)
plt.show()