我想要开发一款音频处理软件,可以检测主导频率,如果这个频率连续播放足够长的时间(几毫秒),就能确认匹配成功。我知道需要使用FFT或类似的算法,但我在这方面的数学知识比较差,我查阅了互联网,但没有找到只能实现这一功能的代码。
我的目标是创建一种自定义协议来通过声音传输数据,每秒需要非常低的比特率(5-10bps),但发送端非常受限,因此接收软件必须能够定制(不能使用实际的硬件/软件调制解调器)。另外,我希望这只是软件(除了声卡外不需要额外的硬件)。
非常感谢您的帮助。
我想要开发一款音频处理软件,可以检测主导频率,如果这个频率连续播放足够长的时间(几毫秒),就能确认匹配成功。我知道需要使用FFT或类似的算法,但我在这方面的数学知识比较差,我查阅了互联网,但没有找到只能实现这一功能的代码。
我的目标是创建一种自定义协议来通过声音传输数据,每秒需要非常低的比特率(5-10bps),但发送端非常受限,因此接收软件必须能够定制(不能使用实际的硬件/软件调制解调器)。另外,我希望这只是软件(除了声卡外不需要额外的硬件)。
非常感谢您的帮助。
然而,如果你想要更简单的东西,我曾经写过一些用于基音估计的代码,你可以采纳或者放弃。它的精确度不如使用 aubio 中的算法,但也许对你的需求足够了。 我基本上只是对数据进行了 FFT 并乘以一个窗口(在这种情况下是 Blackman 窗口),平方了 FFT 值,找到了具有最高值的 bin,并使用最大值及其两个相邻值的对数来进行峰值周围的二次插值以找到基频率。 二次插值是我从某篇论文中得到的。
它在测试音调上表现得相当不错,但它将不像上面提到的其他方法那样稳健或精确。 可以通过增加块大小来增加准确性(或通过减小块大小来减少准确性)。块大小应为2的倍数,以充分利用FFT。此外,我仅对每个块确定基本音高,而没有重叠。 我使用PyAudio 播放声音并同时输出估计的音高。
源代码:
# Read in a WAV and find the freq's
import pyaudio
import wave
import numpy as np

chunk = 2048

# open up a wave
wf = wave.open('test-tones/440hz.wav', 'rb')
swidth = wf.getsampwidth()
RATE = wf.getframerate()
# use a Blackman window
window = np.blackman(chunk)
# open stream
p = pyaudio.PyAudio()
stream = p.open(format =
                p.get_format_from_width(wf.getsampwidth()),
                channels = wf.getnchannels(),
                rate = RATE,
                output = True)

# read some data
data = wf.readframes(chunk)
# play stream and find the frequency of each chunk
while len(data) == chunk*swidth:
    # write data out to the audio stream
    stream.write(data)
    # unpack the data and times by the hamming window
    indata = np.array(wave.struct.unpack("%dh"%(len(data)/swidth),\
                                         data))*window
    # Take the fft and square each value
    fftData=abs(np.fft.rfft(indata))**2
    # find the maximum
    which = fftData[1:].argmax() + 1
    # use quadratic interpolation around the max
    if which != len(fftData)-1:
        y0,y1,y2 = np.log(fftData[which-1:which+2:])
        x1 = (y2 - y0) * .5 / (2 * y1 - y2 - y0)
        # find the frequency and output it
        thefreq = (which+x1)*RATE/chunk
        print "The freq is %f Hz." % (thefreq)
    else:
        thefreq = which*RATE/chunk
        print "The freq is %f Hz." % (thefreq)
    # read some more data
    data = wf.readframes(chunk)
if data:
    stream.write(data)
stream.close()
p.terminate()
import numpy as np
import matplotlib.pyplot as plt
from sklearn.metrics import auc
np.random.seed(0)
# Sine sample with a frequency of 5hz and add some noise
sr = 32 # sampling rate
y = np.linspace(0, 5 * 2*np.pi, sr)
y = np.tile(np.sin(y), 5)
y += np.random.normal(0, 1, y.shape)
t = np.arange(len(y)) / float(sr)
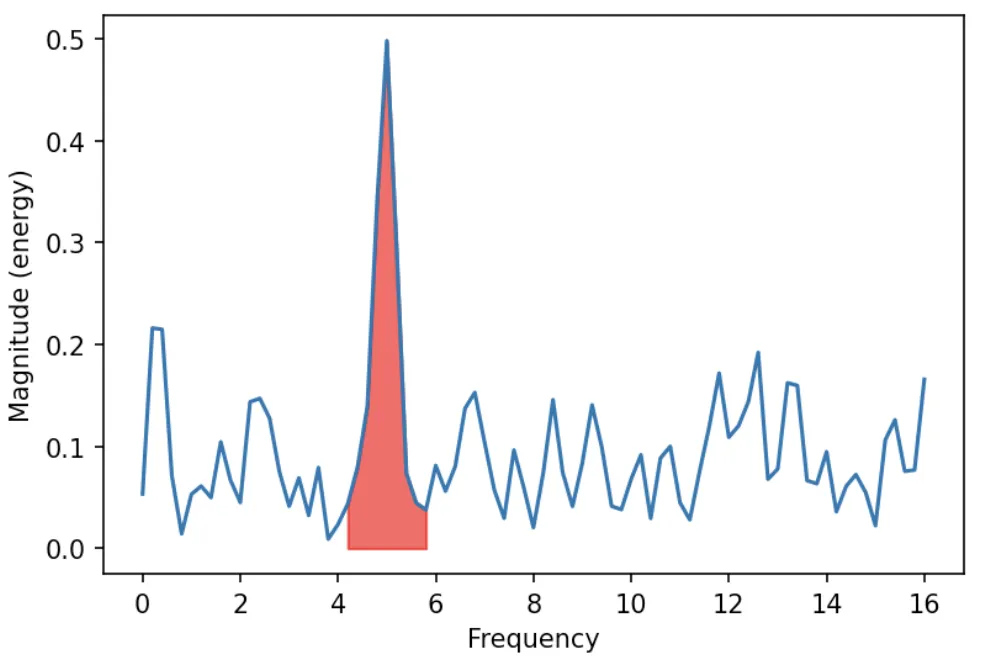
# Generate frquency spectrum
spectrum, freqs, _ = plt.magnitude_spectrum(y, sr)
# Calculate percentage for a frequency range
lower_frq, upper_frq = 4, 6
ind_band = np.where((freqs > lower_frq) & (freqs < upper_frq))
plt.fill_between(freqs[ind_band], spectrum[ind_band], color='red', alpha=0.6)
frq_band_perc = auc(freqs[ind_band], spectrum[ind_band]) / auc(freqs, spectrum)
print('{:.1%}'.format(frq_band_perc))
# 19.8%
虽然我以前没有尝试过使用Python进行音频处理,但也许你可以基于SciPy(或其子项目NumPy)构建一些东西,这是一个高效的科学/工程数值计算框架?你可以从scipy.fftpack开始研究你的FFT。