Python中的音频频率

8

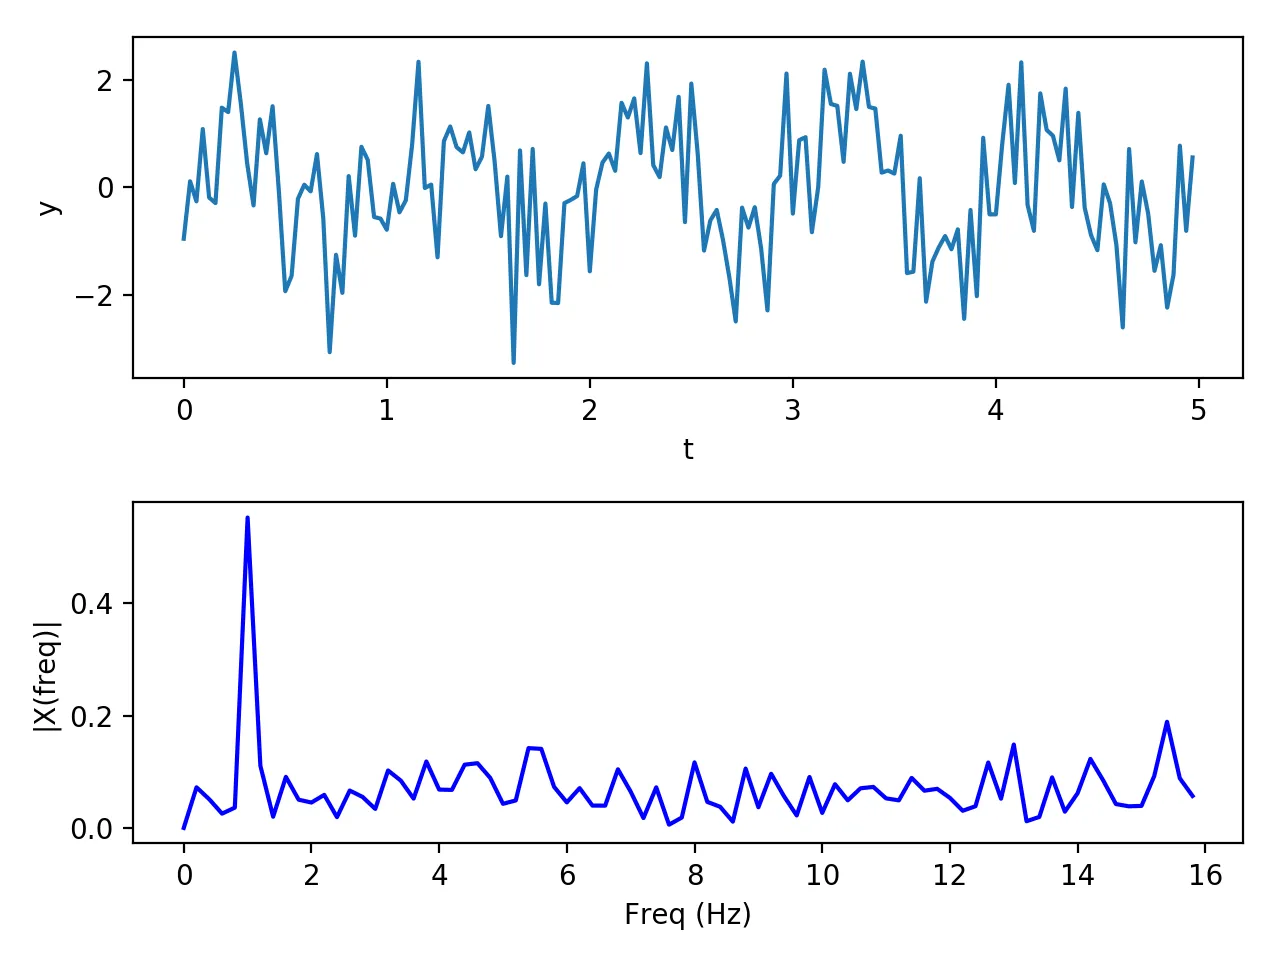
我正在编写一段代码来分析人声唱出的单个音频频率。我需要一种方法来分析音符的频率。目前,我正在使用PyAudio来记录音频文件,该文件存储为.wav,然后立即播放它。

import numpy as np
import pyaudio
import wave

# open up a wave
wf = wave.open('file.wav', 'rb')
swidth = wf.getsampwidth()
RATE = wf.getframerate()
# use a Blackman window
window = np.blackman(chunk)
# open stream
p = pyaudio.PyAudio()
stream = p.open(format =
                p.get_format_from_width(wf.getsampwidth()),
                channels = wf.getnchannels(),
                rate = RATE,
                output = True)

# read some data
data = wf.readframes(chunk)

print(len(data))
print(chunk*swidth)

# play stream and find the frequency of each chunk
while len(data) == chunk*swidth:
    # write data out to the audio stream
    stream.write(data)
    # unpack the data and times by the hamming window
    indata = np.array(wave.struct.unpack("%dh"%(len(data)/swidth),\
                                         data))*window
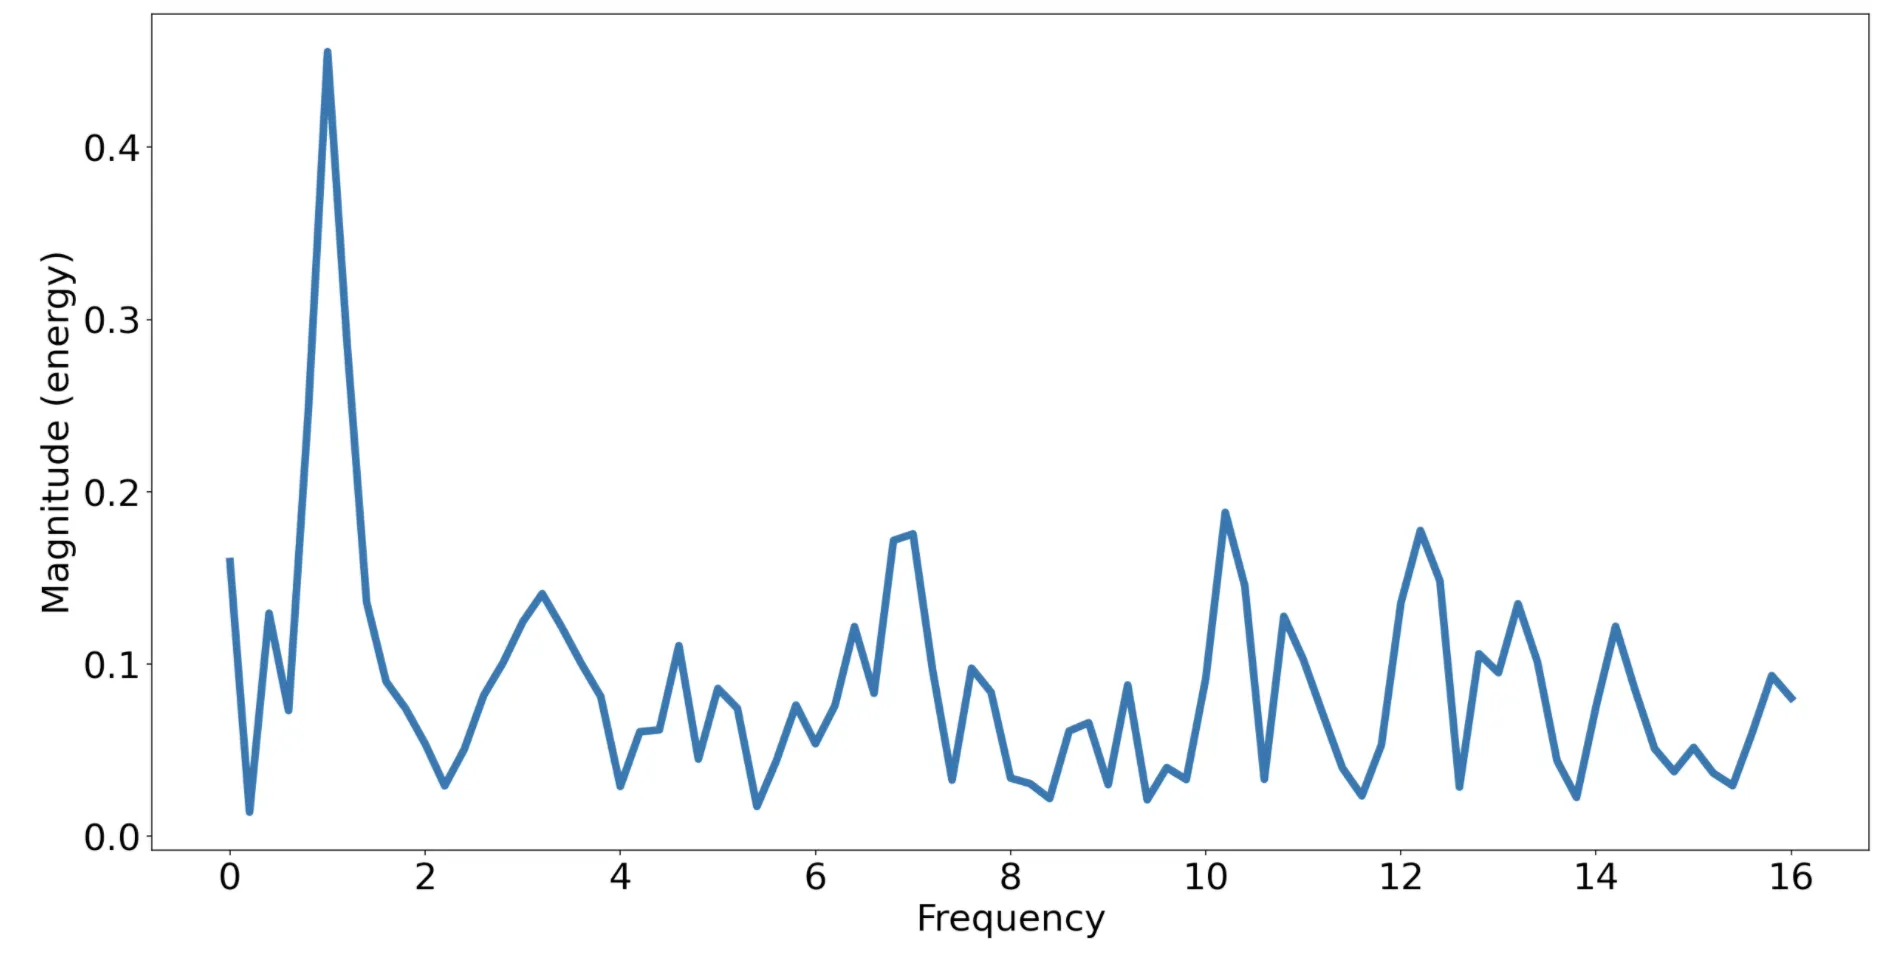
    # Take the fft and square each value
    fftData=abs(np.fft.rfft(indata))**2
    # find the maximum
    which = fftData[1:].argmax() + 1
    # use quadratic interpolation around the max
    if which != len(fftData)-1:
        y0,y1,y2 = np.log(fftData[which-1:which+2:])
        x1 = (y2 - y0) * .5 / (2 * y1 - y2 - y0)
        # find the frequency and output it
        thefreq = (which+x1)*RATE/chunk
        print("The freq is %f Hz." % (thefreq))
    else:
        thefreq = which*RATE/chunk
        print("The freq is %f Hz." % (thefreq))
    # read some more data
    data = wf.readframes(chunk)
if data:
    stream.write(data)
stream.close()
p.terminate()

问题出现在while循环中。某种原因导致条件从未满足。我输出了两个值(len(data)和(chunk * swidth)),它们分别为8192和4096。然后我尝试在while循环中使用2 * chunk * swidth,结果出现了错误:
File "C:\Users\Ollie\Documents\Computing A Level CA\pyaudio test.py", line 102, in <module>
data))*window
ValueError: operands could not be broadcast together with shapes (4096,) (2048,)

Scipy具有信号处理功能,而这个答案讨论了其他可能性。 - G. Anderson
二进制、十六进制和十进制都代表同一件事情。
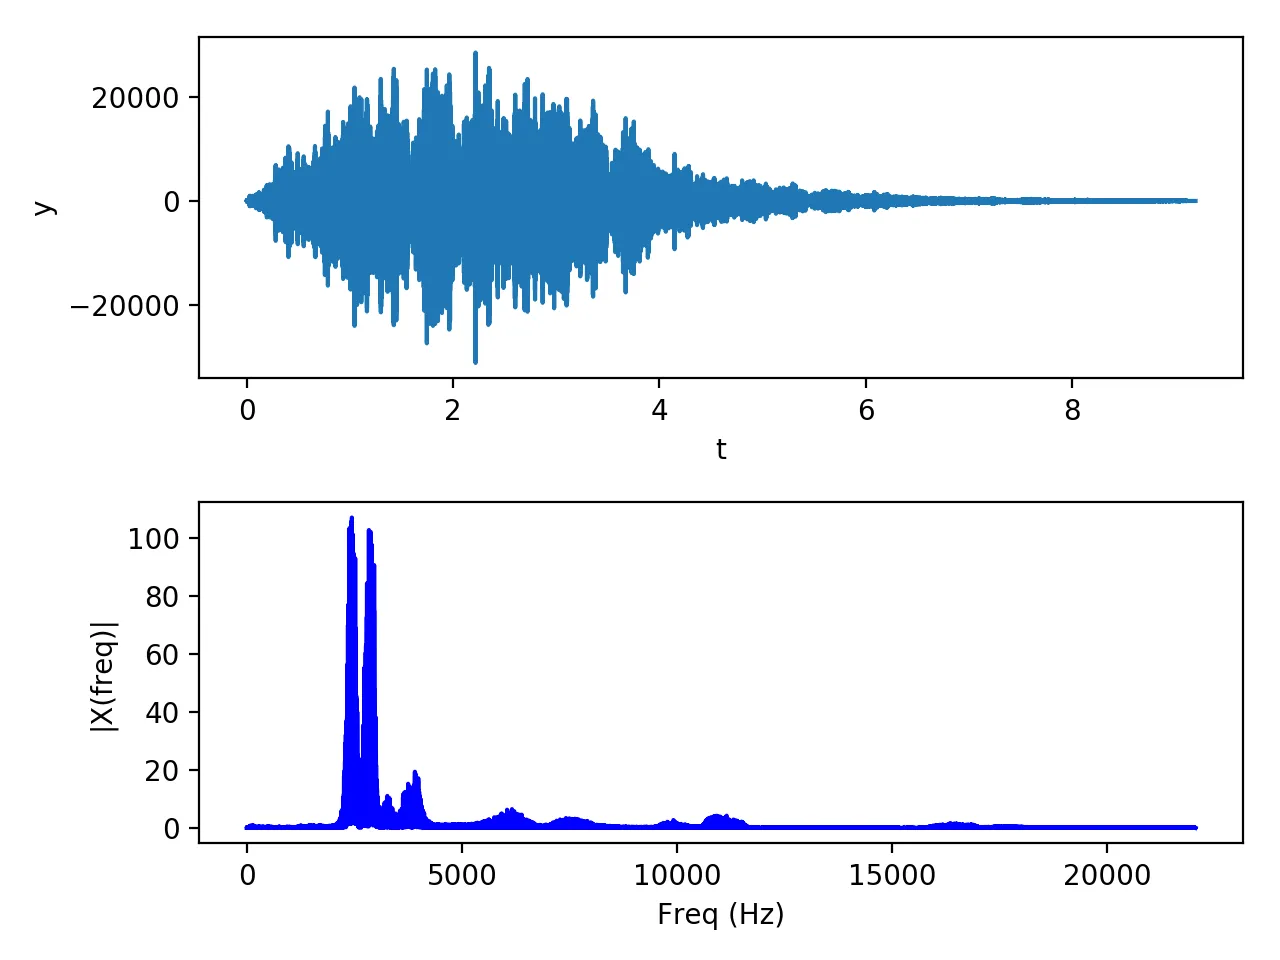
0xA=10=1010。仅通过FFT运行数据无法给出基本频率。声音会产生多个频率,因此需要进行更多的处理和分析才能得到频率 - amitchone
1个回答

17

以下函数用于查找频谱。我还包括了正弦信号和WAV文件示例应用程序。这是为教育目的而设计的;您也可以使用现成的matplotlib.pyplot.magnitude_spectrum(见下文)。

from scipy import fft, arange
import numpy as np
import matplotlib.pyplot as plt
from scipy.io import wavfile
import os


def frequency_spectrum(x, sf):
    """
    Derive frequency spectrum of a signal from time domain
    :param x: signal in the time domain
    :param sf: sampling frequency
    :returns frequencies and their content distribution
    """
    x = x - np.average(x)  # zero-centering

    n = len(x)
    k = arange(n)
    tarr = n / float(sf)
    frqarr = k / float(tarr)  # two sides frequency range

    frqarr = frqarr[range(n // 2)]  # one side frequency range

    x = fft(x) / n  # fft computing and normalization
    x = x[range(n // 2)]

    return frqarr, abs(x)


# Sine sample with a frequency of 1hz and add some noise
sr = 32  # sampling rate
y = np.linspace(0, 2*np.pi, sr)
y = np.tile(np.sin(y), 5)
y += np.random.normal(0, 1, y.shape)
t = np.arange(len(y)) / float(sr)

plt.subplot(2, 1, 1)
plt.plot(t, y)
plt.xlabel('t')
plt.ylabel('y')

frq, X = frequency_spectrum(y, sr)

plt.subplot(2, 1, 2)
plt.plot(frq, X, 'b')
plt.xlabel('Freq (Hz)')
plt.ylabel('|X(freq)|')
plt.tight_layout()


# wav sample from https://freewavesamples.com/files/Alesis-Sanctuary-QCard-Crickets.wav
here_path = os.path.dirname(os.path.realpath(__file__))
wav_file_name = 'Alesis-Sanctuary-QCard-Crickets.wav'
wave_file_path = os.path.join(here_path, wav_file_name)
sr, signal = wavfile.read(wave_file_path)

y = signal[:, 0]  # use the first channel (or take their average, alternatively)
t = np.arange(len(y)) / float(sr)

plt.figure()
plt.subplot(2, 1, 1)
plt.plot(t, y)
plt.xlabel('t')
plt.ylabel('y')

frq, X = frequency_spectrum(y, sr)

plt.subplot(2, 1, 2)
plt.plot(frq, X, 'b')
plt.xlabel('Freq (Hz)')
plt.ylabel('|X(freq)|')
plt.tight_layout()

plt.show()

正弦信号


WAV文件

如果您想了解更多信息,可以参考SciPy傅里叶变换Matplotlib的幅度谱绘制页面。

magspec = plt.magnitude_spectrum(y, sr)  # returns a tuple with the frequencies and associated magnitudes

enter image description here


嗨,这对正弦波很有效,但我需要改变输入为wav文件,我需要改变什么?我尝试用数据数组替换y,但似乎不起作用。 - Ollie
1
你是否先将数组的平均值设为0?我已经将此步骤移至函数本身。我还有将wav转换为数组的代码,很快会添加在这里。 - Reveille
添加了一个 WAV 示例。 - Reveille
谢谢,它运行得非常好。如果你想打印出频率,你需要在X中找到最大值,然后使用frq数组中相同的索引。 - Ollie
1
如果您按照上面的代码运行,您将会得到一个错误提示:"TypeError: 'module' object is not callable"。将第24行改为 " x = fft.fft(x) / n # fft computing and normalization" 可以解决这个问题。您也可能会收到有关 scipy.arange 废弃警告的提示,并建议使用 numpy.arange。 - BalooRM

网页内容由stack overflow 提供, 点击上面的
可以查看英文原文,
原文链接