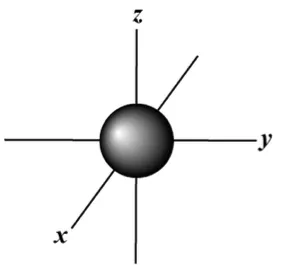
这个怎么样?
如果你想要加粗文本: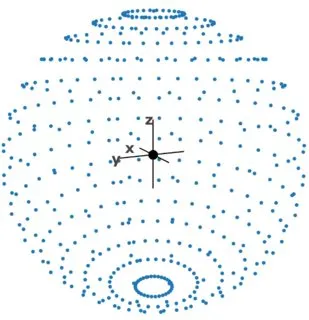
我认为如果我可以让文本加粗,它会看起来更好。在函数getvals中将创建的对象annots中,当你看到text = "x"(y或z)时,如果你想要加粗,就注释如下text = "<b>x</b>"。
我试图使其动态化,以便更容易地重新使用,但我没有测试任何可能的Plotly极端情况。它基于这样一个假设:只有1个跟踪器,并且该跟踪器是scatter3d。
我想指出,将线标记为mode = "lines"一直被Plotly推翻,渲染为lines+markers。如果我不将其指定为lines+markers,我也无法控制标记。这就是为什么你看到标记被调用但实际上被隐藏的原因。
getvals <- function(plt) {
plt <- plotly_build(plt)
if(isTRUE(length(plt$x$data) == 1)) {
df1 <- data.frame(x = plt$x$data[[1]]$x,
y = plt$x$data[[1]]$y,
z = plt$x$data[[1]]$z)
mx <- max(df1$x); my <- max(df1$y); mz <- max(df1$z)
nx <-.25 * mx; ny <- .25 * my; nz <- .25 * mz
d <- colMeans(df1)
dx <- d[[1]]; dy <- d[[2]]; dz <- d[[3]]
hx <- dx + nx; hy <- dy + ny; hz <- dz + nz
lx <- dx - nx; ly <- dy - ny; lz <- dz - nz
plt <- plt %>%
add_trace(x = c(lx, hx), y = c(dy, dy), z = c(dz, dz),
mode = "lines+markers",
hoverinfo = "skip", marker = list(size = .01),
line = list(color = "black", width = 3)) %>%
add_trace(x = c(dx, dx), y = c(ly, hy), z = c(dz, dz),
mode = "lines+markers",
hoverinfo = "skip", marker = list(size = .01),
line = list(color = "black", width = 3)) %>%
add_trace(x = c(dx, dx), y = c(dy, dy), z = c(lz, hz),
mode = "lines+markers",
hoverinfo = "skip", marker = list(size = .01),
line = list(color = "black", width = 3)) %>%
add_trace(x = dx, y = dy, z = dz, type = "scattered",
mode = "markers", hoverinfo = "skip",
marker = list(size = 8, color = "black"))
annots <- list(
list(showarrow = F, x = hx, y = dy, z = dz,
text = "x", xanchor = "right", xshift = -5,
font = list(size = 20)),
list(showarrow = F, x = dx, y = hy, z = dz,
text = "y", xshift = -5,
font = list(size = 20)),
list(showarrow = F, x = dx, y = dy, z = hz,
text = "z", xshift = -5,
font = list(size = 20)))
assign("annots", annots, envir = .GlobalEnv)
plt
}
}
使用该函数
使用原始图表,但不包括对“layout”的调用。我添加了
showlegend = F,因为当添加其他跟踪时,它会创建一个图例。您可以将其导入到图表中,也可以像这样操作。
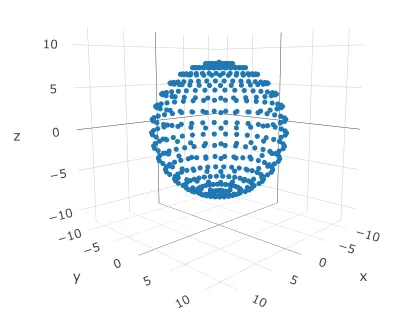
fig = plot_ly(df, x = ~x, y = ~y, z = ~z, type = "scatter3d",
mode = "markers", marker = list(size = 3),
showlegend = F)
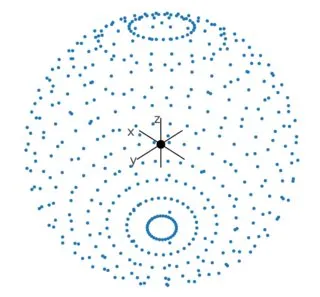
fig %>% getvals() %>%
layout(
scene = list(
aspectratio = list(x = 1, y = 1, z = 1),
camera = list(
center = list(x = 0, y = 0, z = 0),
eye = list(x = -.5, y = .5, z = .6)),
up = list(x = 0, y = 0, z = 1),
xaxis = list(showgrid = FALSE, zeroline = FALSE, range = c(-12, 12),
showticklabels = FALSE, title = list(text = "")),
yaxis = list(showgrid = FALSE, zeroline = FALSE, range = c(-12, 12),
showticklabels = FALSE, title = list(text = "")),
zaxis = list(showgrid = FALSE, zeroline = FALSE, range = c(-12, 12),
showticklabels = FALSE, title = list(text = "")),
dragmode = "turntable",
annotations = annots
), margin = list(t = 30, r = 30, l = 30, b = 30, padding = 2))