将Pandas字符串数据框转换为直方图。

22

假设我有一个像这样创建的DataFrame:

import pandas as pd
s1 = pd.Series(['a', 'b', 'a', 'c', 'a', 'b'])
s2 = pd.Series(['a', 'f', 'a', 'd', 'a', 'f', 'f'])
d = pd.DataFrame({'s1': s1, 's2', s2})

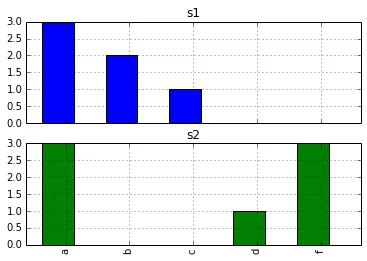
真实数据中的字符串非常稀疏。我希望创建出与d.hist()生成的s1和s2的直方图类似(例如,带有子图的直方图)的字符串出现次数的直方图(每个子图一个)。

仅执行d.hist()会出现以下错误:

/Library/Python/2.7/site-packages/pandas/tools/plotting.pyc in hist_frame(data, column, by, grid, xlabelsize, xrot, ylabelsize, yrot, ax, sharex, sharey, **kwds)
   1725         ax.xaxis.set_visible(True)
   1726         ax.yaxis.set_visible(True)
-> 1727         ax.hist(data[col].dropna().values, **kwds)
   1728         ax.set_title(col)
   1729         ax.grid(grid)

/Library/Python/2.7/site-packages/matplotlib/axes.pyc in hist(self, x, bins, range, normed, weights, cumulative, bottom, histtype, align, orientation, rwidth, log, color, label, stacked, **kwargs)
   8099             # this will automatically overwrite bins,
   8100             # so that each histogram uses the same bins
-> 8101             m, bins = np.histogram(x[i], bins, weights=w[i], **hist_kwargs)
   8102             if mlast is None:
   8103                 mlast = np.zeros(len(bins)-1, m.dtype)

/System/Library/Frameworks/Python.framework/Versions/2.7/Extras/lib/python/numpy/lib/function_base.pyc in histogram(a, bins, range, normed, weights, density)
    167             else:
    168                 range = (a.min(), a.max())
--> 169         mn, mx = [mi+0.0 for mi in range]
    170         if mn == mx:
    171             mn -= 0.5

TypeError: cannot concatenate 'str' and 'float' objects

我想我可以手动地逐个系列进行value_counts(),然后将其绘制成柱状图,并手动创建子图。我想确认是否有更简单的方法。


所有涉及到value_count的答案都是错误的,因为问题是关于生成直方图而不仅仅是计数值。对于一组字符串的直方图最好以分类和可排序数据的形式进行捕获,包括最小值、最大值、区间和总排序。 - natbusa
4个回答

33

重新创建数据框:

import pandas as pd
s1 = pd.Series(['a', 'b', 'a', 'c', 'a', 'b'])
s2 = pd.Series(['a', 'f', 'a', 'd', 'a', 'f', 'f'])
d = pd.DataFrame({'s1': s1, 's2': s2})

要按照要求获得带有子图的直方图:

d.apply(pd.value_counts).plot(kind='bar', subplots=True)

在此输入图像描述

问题中提到了 pd.value_counts。我认为缺少的部分只是没有必要“手动”创建所需的条形图。

d.apply(pd.value_counts) 的输出是一个 pandas 数据帧。我们可以像任何其他数据帧一样绘制值,并选择选项 subplots=True,这样就可以得到我们想要的结果。


这很简单!有没有想法为什么matplotlib的hist无法绘制相同的图表(它只是需要很长时间),而不是像这里一样使用value_counts和条形图? - matanster

11
您可以使用pd.value_counts(value_counts也是一个Series方法):
In [20]: d.apply(pd.value_counts)
Out[20]: 
   s1  s2
a   3   3
b   2 NaN
c   1 NaN
d NaN   1
f NaN   3

然后绘制生成的DataFrame。


1
我会将Series转换为collections.Counter(documentation)对象(您可能需要先将其转换为列表)。我不是pandas专家,但我认为您应该能够将Counter对象放回Series中,以字符串索引,并使用它来制作图表。由于此方法尝试猜测字符串的边缘位置,因此会产生错误。

Ag,你抢先一步了!没错,计数器正是这个任务所需的工具! - Andy Hayden
1
感谢您的回复。value_counts执行相同的操作,是一种Series -> Series转换(因此无需将其强制转换回Series)。我想知道是否有某些选项可以自动为我完成这种特定情况下字符串的计数和绘图,因为对于整数有一个选项。 - amatsukawa

0
你还可以使用:
df_normalized["configuration.runtime"].value_counts().plot(kind = 'barh') # or bar

由于value_counts已被弃用。

网页内容由stack overflow 提供, 点击上面的
可以查看英文原文,
原文链接