我使用fitdistrplus包中的fitdist函数来获取最适合我的数据的分布,并绘制ppcomp图,我使用?fitdistrplus的示例代码替换了我的数据和代码。
data(groundbeef)
serving <- groundbeef$serving
fitW <- fitdist(serving, "weibull")
fitg <- fitdist(serving, "gamma")
fitln <- fitdist(serving, "lnorm")
ppcomp(list(fitW, fitg, fitln), legendtext=c("Weibull", "gamma", "lognormal"))
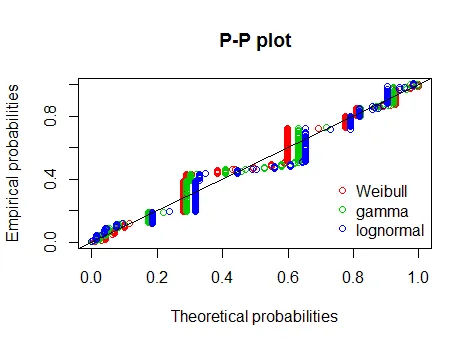
目前为止一切顺利!但是看一下图片左下角,有一些空间,或者坐标轴没有从零开始!
所以我谷歌搜索到两种方法:
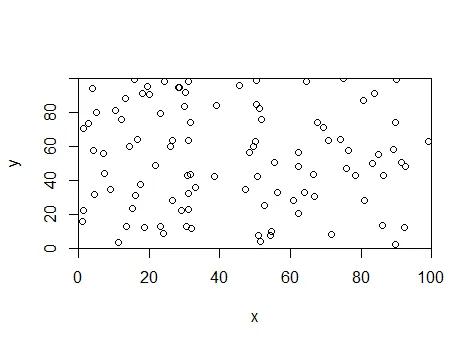
在基础图中,使用 xaxs 和 yaxs。
set.seed(1234)
x <- runif(100, min=0, max=100)
y <- runif(100, min=0, max=100)
plot(x,y,xaxs="i",yaxs="i",xlim=c(0,100),ylim=c(0,100))
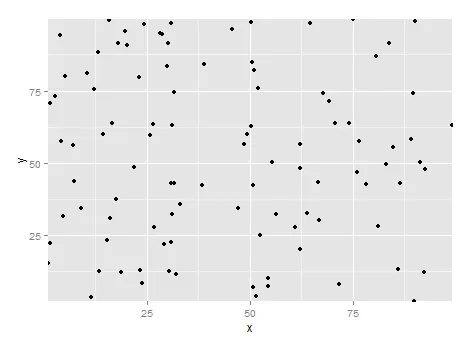
在 ggplot2 中,还有一种方法可以使用 expand=c(0,0)。
df <- data.frame(x=x,y=y)
ggplot(df,aes(x,y)) + geom_point() + scale_x_continuous(expand = c(0,0)) + scale_y_continuous(expand = c(0,0))
所以我尝试使用这两种方法来绘制ppcomp图:
ppcomp(list(fitW, fitg, fitln), legendtext=c("Weibull", "gamma", "lognormal"),xaxs="i",yaxs="i")
但出现错误:
Error in legend(x = xlegend, y = ylegend, bty = "n", legend = legendtext,  :
  unused arguments (xaxs = "i", yaxs = "i")
那么,我应该怎么做才能完成目标而不出错,或者说正确的代码是什么?