filled.contour与ggplot2 + stat_contour的比较

8

我是 ggplot2 的新手,正在尝试使用 ggplot2 复制一个我之前用 filled.contour 创建的图形。

以下是我的代码:

require(ggplot2)
require(reshape2)

#data prep
scale <- 10

xs <- scale * c(0, 0.5, 0.8, 0.9, 0.95, 0.99, 1)
ys <- scale * c(0, 0.01, 0.05, 0.1, 0.2, 0.5, 1)

df <- data.frame(expand.grid(xs,ys))
colnames(df) <- c('x','y')
df$z <- ((scale-df$x) * df$y) / ((scale-df$x) * df$y + 1)

#filled contour looks good
filled.contour(xs, ys, acast(df, x~y, value.var='z'))

#ggplot contour looks bad
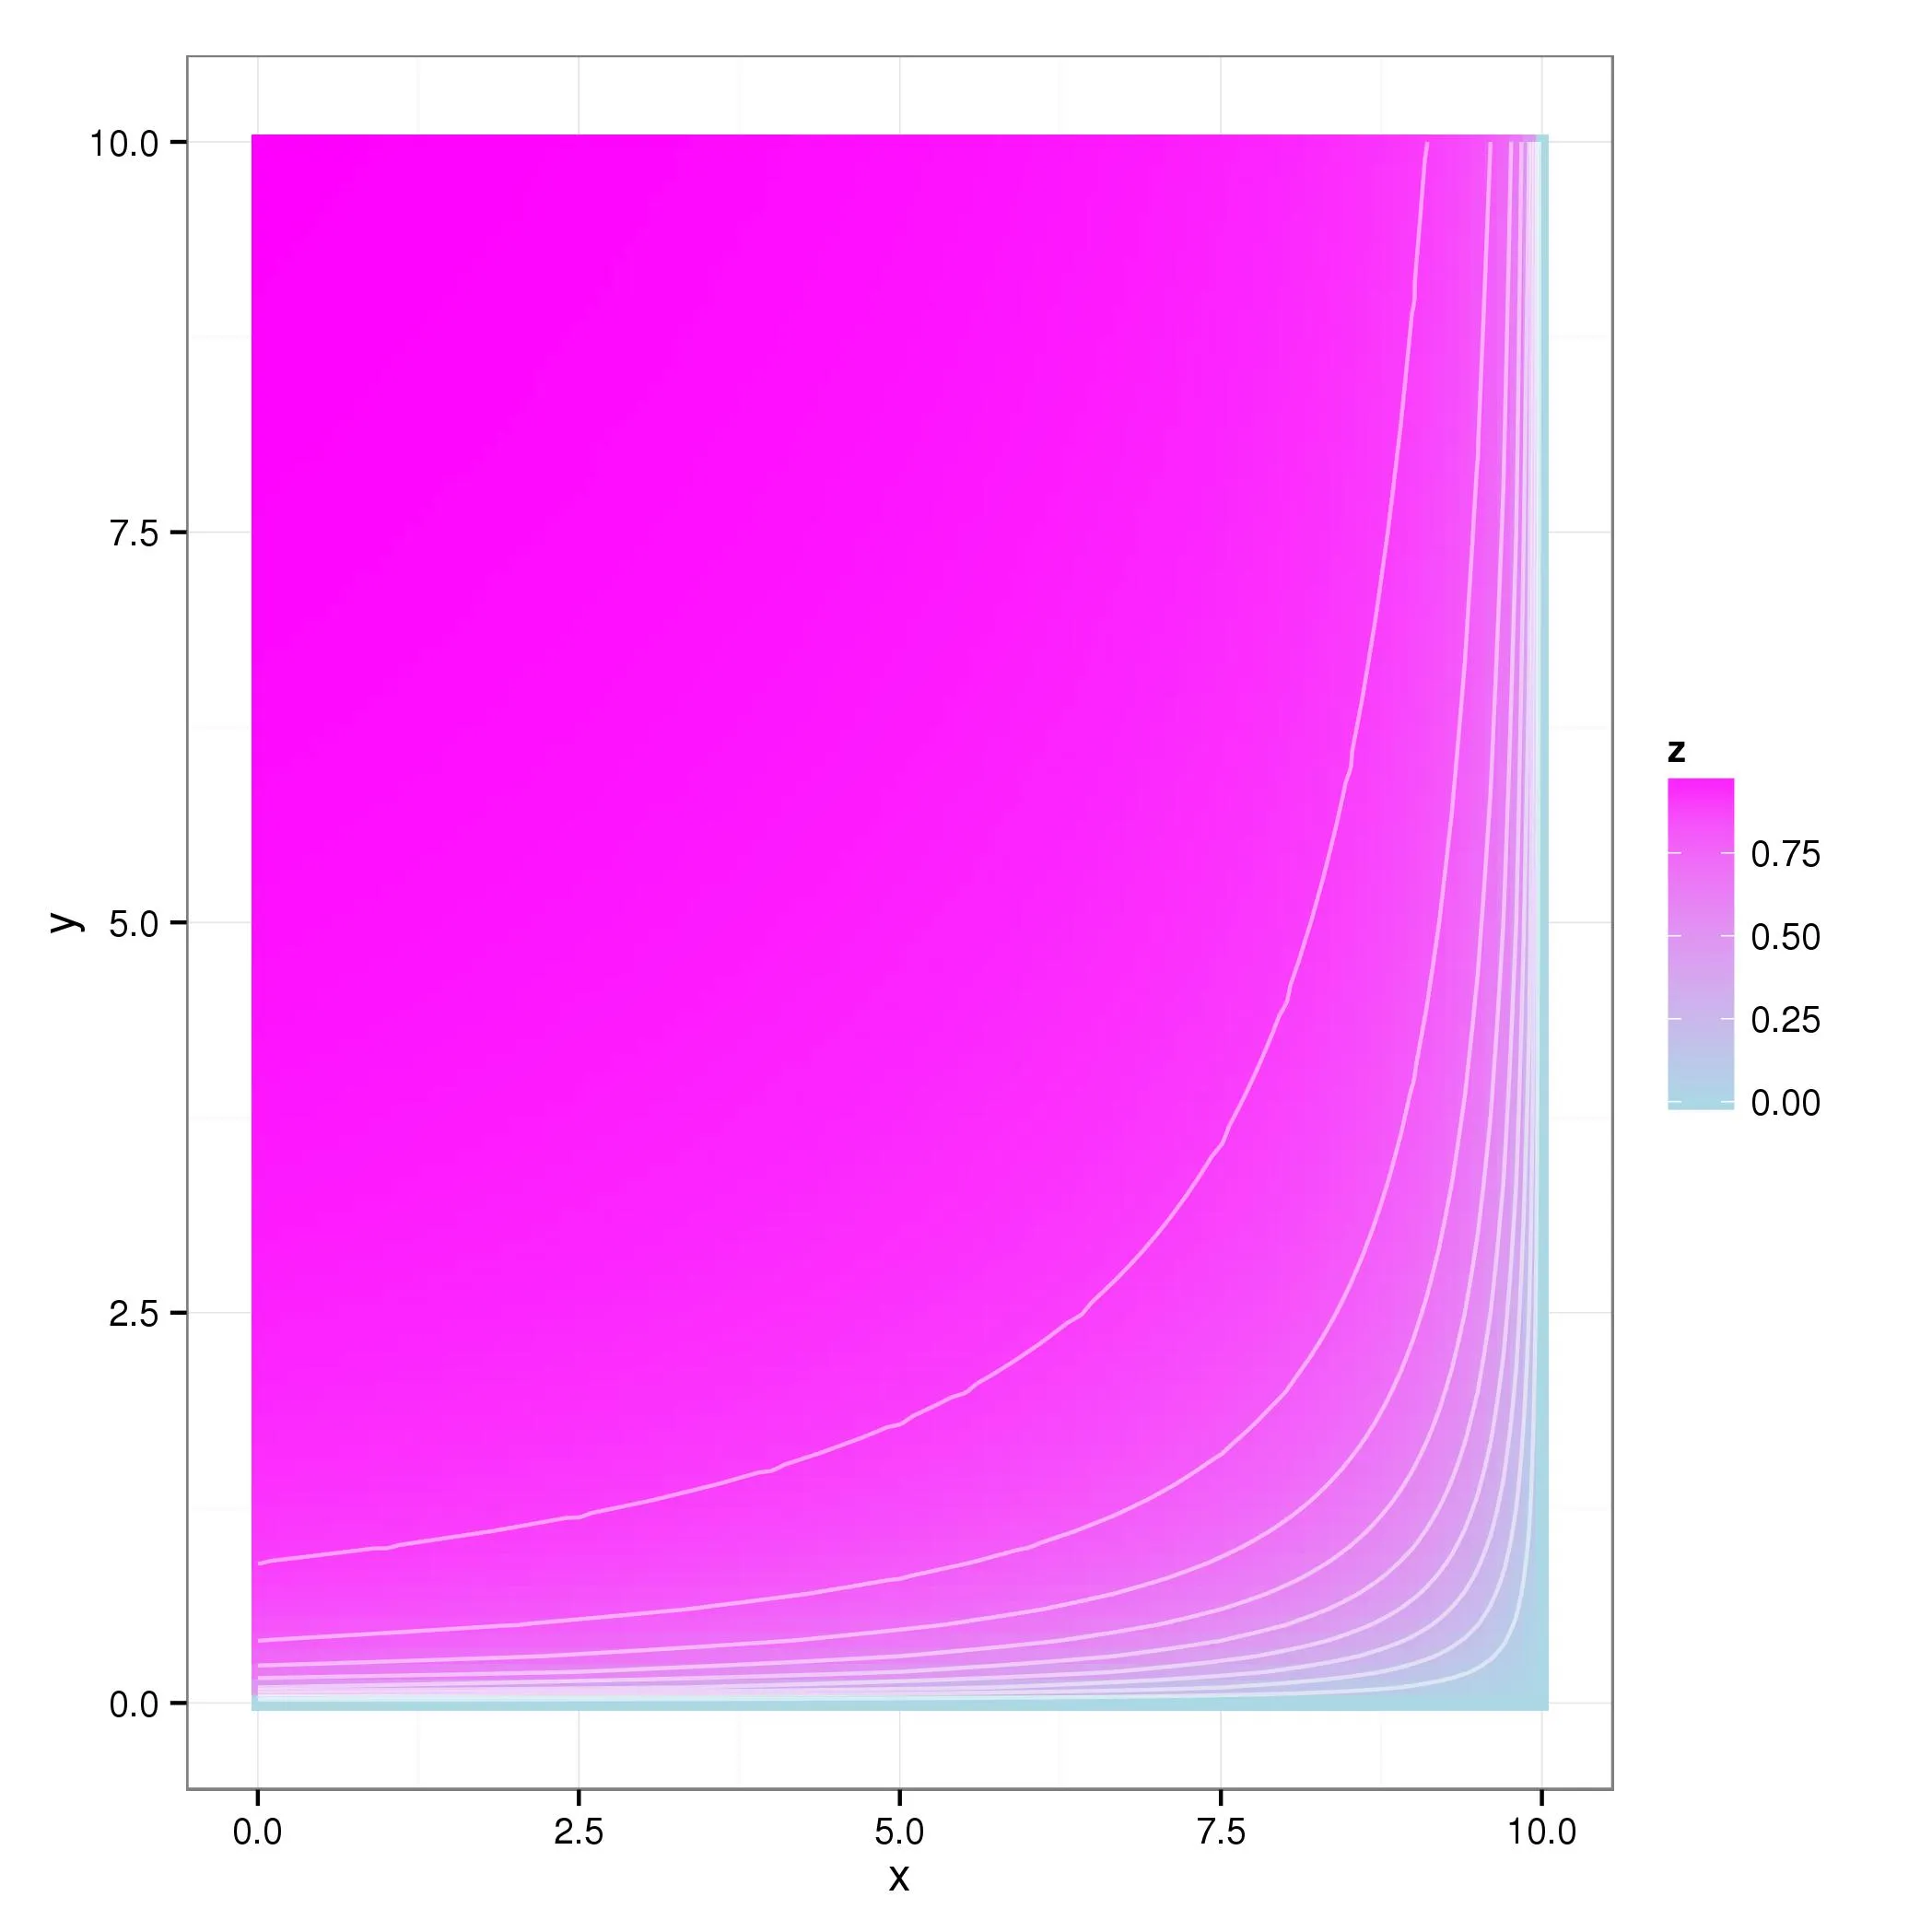
p <- ggplot(df, aes(x=x, y=y, z=z))

p + stat_contour(geom='polygon', aes(fill=..level..))

我无法弄清如何让ggplot轮廓线填充多边形,一直到左上角(点(0,10)处z= 0.99)...我得到的只有这些奇怪的三角形。

1个回答

3
要创建一个ggplot版本的filled.contour图,您需要拥有比您示例中的df对象更大的data.frame,并且使用geom_tile将产生您要查找的图。请考虑以下内容:
# a larger data set
scl <- 10
dat <- expand.grid(x = scl * seq(0, 1, by = 0.01), 
                   y = scl * seq(0, 1, by = 0.01))
dat$z <- ((scl - dat$x) * dat$y) / ((scl - dat$x) * dat$y + 1)

# create the plot, the geom_contour may not be needed, but I find it helpful
ggplot(dat) + 
aes(x = x, y = y, z = z, fill = z) + 
geom_tile() + 
geom_contour(color = "white", alpha = 0.5) + 
scale_fill_gradient(low = "lightblue", high = "magenta") + 
theme_bw()

enter image description here


网页内容由stack overflow 提供, 点击上面的
可以查看英文原文,
原文链接