我希望能够通过指定数据坐标的位置来将颜色条放置在散点图内部。 以下是在指定图坐标的情况下它的工作原理的示例:
import numpy as np
import matplotlib.pyplot as plt
#Generate some random data:
a = -2
b = 2
x = (b - a) * np.random.random(50) + a
y = (b - a) * np.random.random(50) + a
z = (b) * np.random.random(50)
#Do a scatter plot
fig = plt.figure()
hdl = plt.scatter(x,y,s=20,c=z,marker='o',vmin=0,vmax=2)
ax = plt.gca()
ax.set_xlim([-2,2])
ax.set_ylim([-2,2])
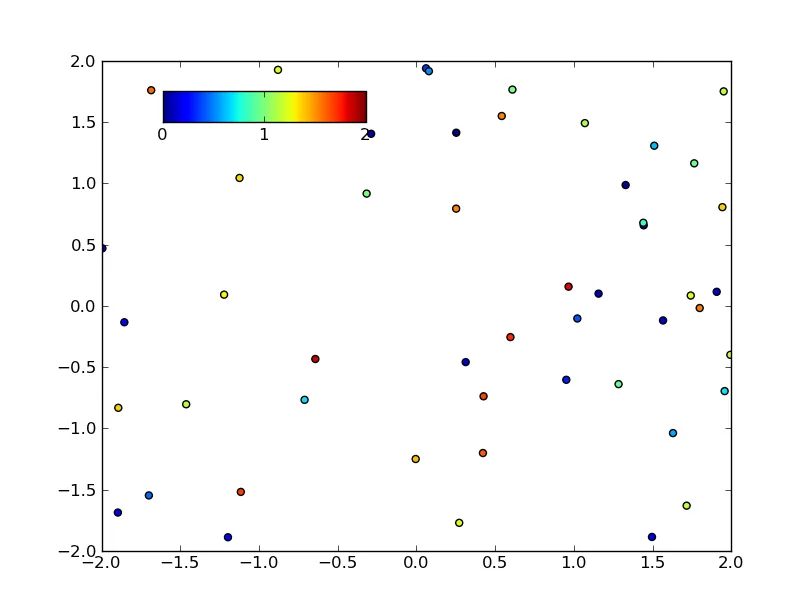
#Specifying figure coordinates works fine:
fig_coord = [0.2,0.8,0.25,0.05]
cbar_ax = fig.add_axes(fig_coord)
clevs = [0, 1 , 2]
cb1 = plt.colorbar(hdl, cax=cbar_ax, orientation='horizontal', ticks=clevs)
plt.show()
现在的问题是,我该如何将颜色条定位到数据坐标上,例如出现在: left, bottom, width, height: -1.5, 1.5, 1, 0.25
我尝试过一些方法,比如确定图中轴的位置并将其转换为数据坐标,但没有成功。
非常感谢您提供的想法或指向已经解决类似问题的链接!
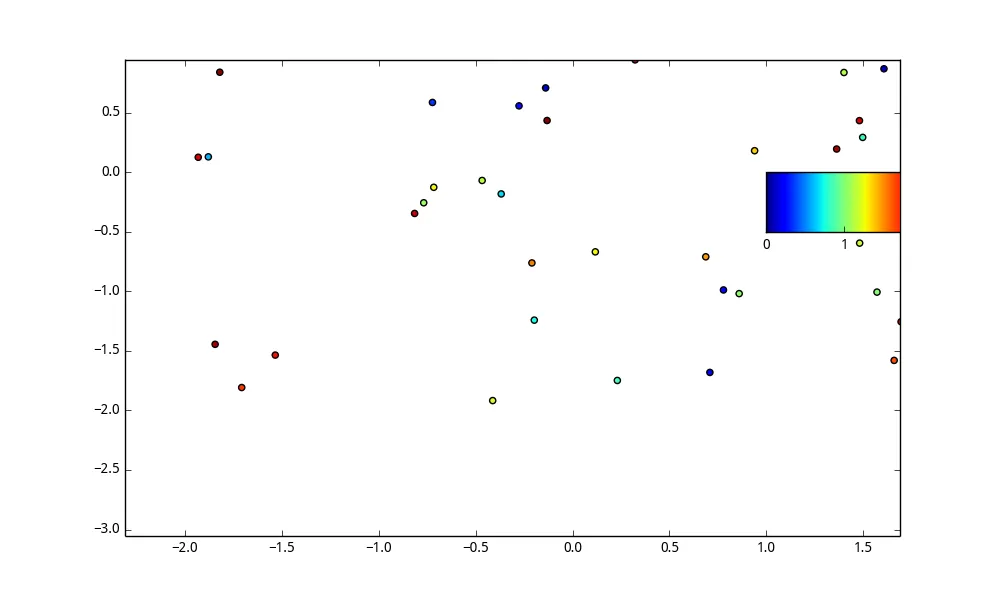
这是我所做的(不是特别美观,但很有帮助)。感谢tcaswell!
#[lower left x, lower left y, upper right x, upper right y] of the desired colorbar:
dat_coord = [-1.5,1.5,-0.5,1.75]
#transform the two points from data coordinates to display coordinates:
tr1 = ax.transData.transform([(dat_coord[0],dat_coord[1]),(dat_coord[2],dat_coord[3])])
#create an inverse transversion from display to figure coordinates:
inv = fig.transFigure.inverted()
tr2 = inv.transform(tr1)
#left, bottom, width, height are obtained like this:
datco = [tr2[0,0], tr2[0,1], tr2[1,0]-tr2[0,0],tr2[1,1]-tr2[0,1]]
#and finally the new colorabar axes at the right position!
cbar_ax = fig.add_axes(datco)
#the rest stays the same:
clevs = [0, 1 , 2]
cb1 = plt.colorbar(hdl, cax=cbar_ax, orientation='horizontal', ticks=clevs)

plt.show()