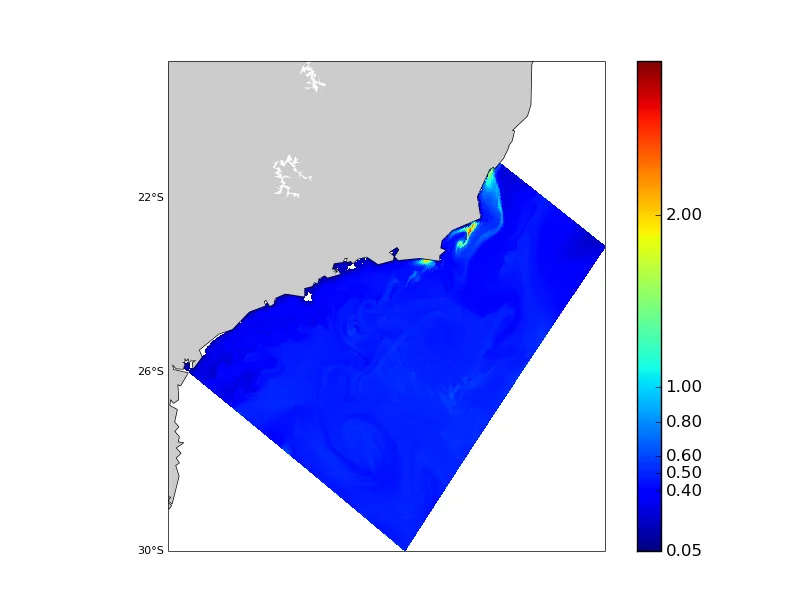
我希望设置色条,以便使用不同颜色区分小值之间的差异。例如:在0.4和0.6之间使用两种不同的颜色。
但我的最大值是3,这使得很难看到这些值。
如何为色条设置不同的颜色间隔,以便我可以看到这种差异?
我尝试了Boundary norm和Log,但都没有奏效。
我附上一些图表以说明。

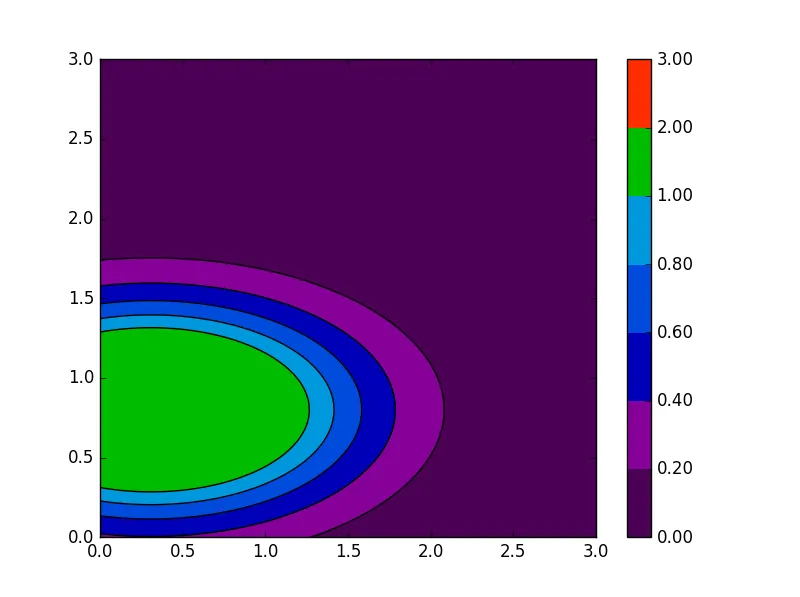
试试这个:
import matplotlib.pyplot as plt
import numpy as np

delta = 0.025

x = y = np.arange(0, 3.01, delta)
X, Y = np.meshgrid(x, y)
Z1 = plt.mlab.bivariate_normal(X, Y, 1.0, 1.0, 0.0, 0.0)
Z2 = plt.mlab.bivariate_normal(X, Y, 1.5, 0.5, 1, 1)
Z = 10e1 * (Z1*Z2)    # Random function creation
levels = np.array([0,0.2,0.4,0.6,0.8,1,2,3])

fig=plt.figure()
ax1 = fig.add_subplot(111)

CF = ax1.contourf(X,Y,Z,
         levels = levels,
         cmap = plt.cm.spectral
        )
CS = ax1.contour(X,Y,Z,
         colors = 'k',    # Black border
         levels = levels
        )


cbar = plt.colorbar(CF, ticks=levels, format='%.2f')
plt.show()
ndarrays。 - wwii