Matplotlib在使用子图时不会显示次刻度线

6

我有几个子图并想通过ax.tick_params调整轴刻度设置。 一切都正常,但是次要刻度未显示。 这是一个代码示例:

import matplotlib.pyplot as plt

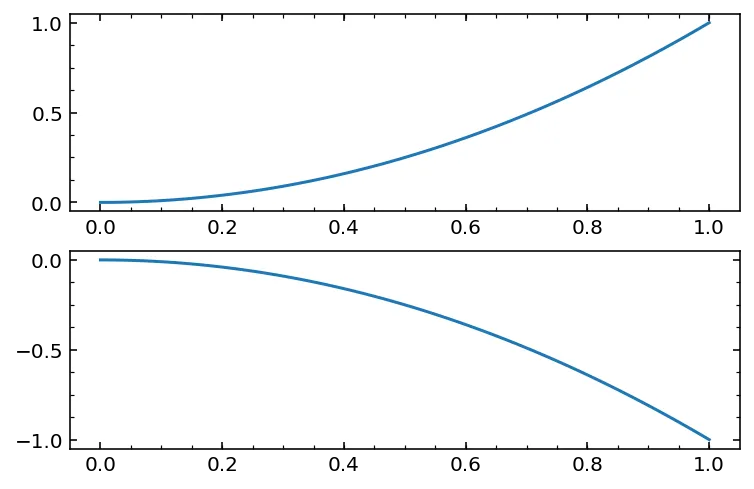
x = np.linspace(0,1,100)
y = x*x

f, (ax1,ax2) = plt.subplots(2, 1)

ax1.tick_params(axis="both", direction="in", which="both", right=False, top=True)
ax2.tick_params(axis="both", direction="in", which="both", right=True, top=False)

ax1.plot(x,y)
ax2.plot(x,-y)

plt.show()

我以为which=both会给我提供次要刻度。然而,我需要添加额外的内容。
plt.minorticks_on()

这使得它们在ax2中可见,但仅限于此。

我该如何解决这个问题?

2个回答

4

使用pyplot的危险在于,你会失去对当前轴的跟踪,例如plt.minorticks_on()命令的操作。因此,最好使用正在使用的轴的相应方法:

ax1.minorticks_on()
ax2.minorticks_on()

2

plt 会在当前坐标轴上工作,而在你的情况下是 ax2。一种方法是首先使用你所做的方式启用它们,然后使用 AutoMinorLocator 指定小刻度的数量。

from matplotlib.ticker import AutoMinorLocator

ax1.tick_params(axis="both", direction="in", which="both", right=False, top=True)
ax2.tick_params(axis="both", direction="in", which="both", right=True, top=False)

ax1.plot(x,y)
ax2.plot(x,-y)

for ax in [ax1, ax2]:
    ax.xaxis.set_minor_locator(AutoMinorLocator(4))
    ax.yaxis.set_minor_locator(AutoMinorLocator(4))

enter image description here


网页内容由stack overflow 提供, 点击上面的
可以查看英文原文,
原文链接