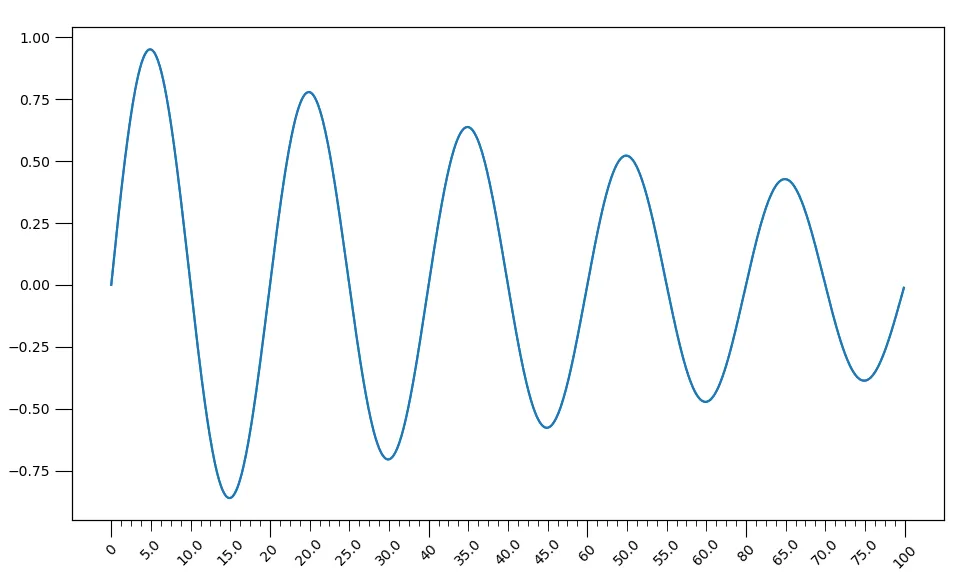
有两种方法。第一种方法比较混乱,最好避免使用,但在这里包含它也没有坏处。第二种方法是由ImportanceOfBeingErnest建议的,并基于如何在Python Matplotlib中添加第三级刻度
fig, ax = plt.subplots()
ax.plot(t, s)

ax.xaxis.set_minor_locator(AutoMinorLocator(9))
ax.tick_params(which='major', length=12, color='k')
minor_labels = list()
i = 0
l = -2
sum_l = 1.125
for line in ax.xaxis.get_ticklines(minor=True):

    if i == 0:
        line.set_markersize(4)
        minor_labels.append('')
        i += 1
        l += sum_l
    elif i == 2:
        line.set_markersize(4)
        minor_labels.append('')
        i += 1
        l += sum_l
    elif i == 4 or i == 6 or i == 10 or i == 12 or i == 16:
        line.set_markersize(4)
        minor_labels.append('')
        i += 1
        l += sum_l
    elif i == 18:
        line.set_markersize(4)
        minor_labels.append('')
        i -= 15
        l += sum_l
    elif i == 8 or i == 14:
        line.set_markersize(8)
        minor_labels.append(l)
        i += 1
        l += sum_l
    else:
        i += 1
        l += sum_l
print(minor_labels)
ax.set_xticklabels(minor_labels,minor=True)
plt.setp(ax.xaxis.get_minorticklabels(), rotation=45)
plt.setp(ax.xaxis.get_ticklabels(), rotation=45)
plt.show()
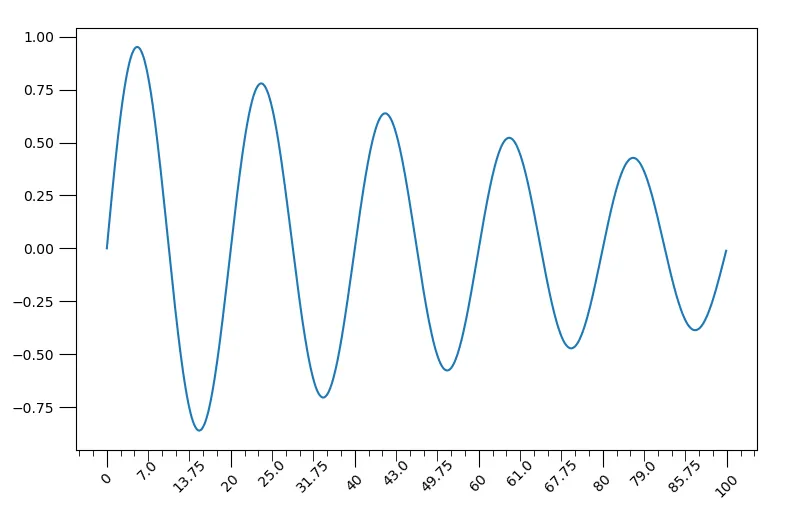
ImportanceOfBeingErnest的解决方案似乎遵循这种逻辑,也许他有其他想法——它看起来更漂亮,但我还没有能够复制出次要/半次要刻度线的组合。也许通过一些调整,您将能够实现您的意图。
t = np.arange(0.0, 100.0, 0.1)
s = np.sin(0.1 * np.pi * t) * np.exp(-t * 0.01)

fig, ax = plt.subplots()
plt.plot(t, s)
ax2 = ax.twiny()
ax2.plot(t, s)
ax2.xaxis.set_ticks_position('bottom')

ax.xaxis.set_minor_locator(ticker.FixedLocator(np.arange(5, 100.01, 5)))
ax.tick_params(which='minor', length=8, color='k')

ax2.xaxis.set_major_locator(ticker.FixedLocator([]))
ax2.xaxis.set_minor_locator(ticker.FixedLocator(np.arange(1.25, 100.01,1.25)))
ax2.tick_params(which='minor', length=4, color='k')

ax.tick_params(which='major', length=12, color='k')
ax.set_xticklabels(np.arange(5, 100.01, 5),minor=True)
plt.setp(ax.xaxis.get_minorticklabels(), rotation=45)
plt.setp(ax.xaxis.get_ticklabels(), rotation=45)
plt.show()