双Y轴绘图:反转第一个轴,但不反转第二个轴。

4
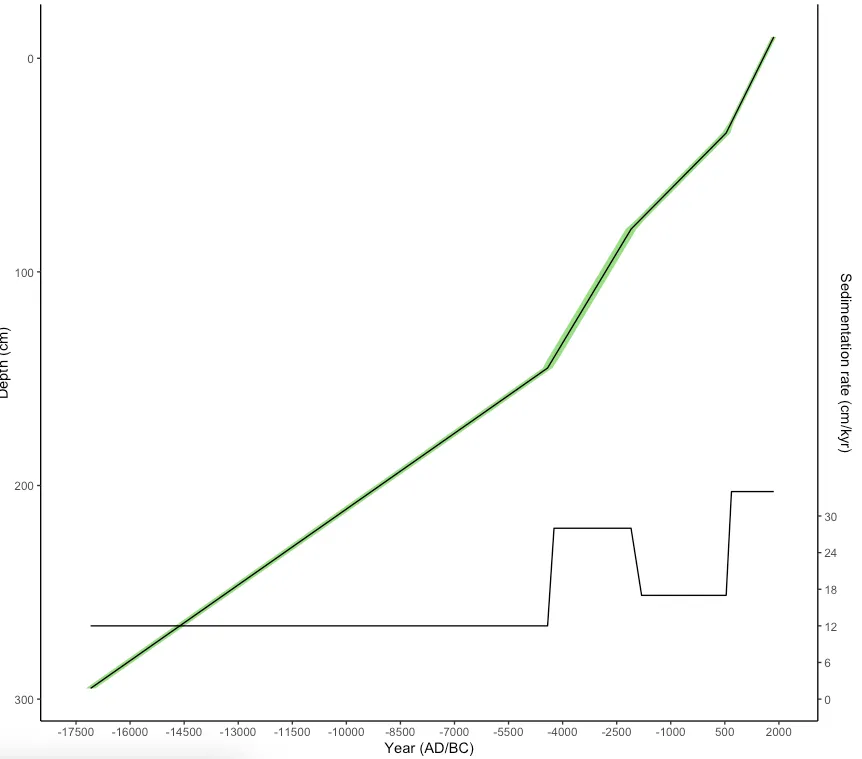
首先,我绘制了一个深度与年龄的折线图。然后,我添加了第二个y轴:沉积速率。
问题是我的第一个y轴(深度)应该是反向的,从0(顶部)到310(底部)。
但是第二个y轴必须是正常的,从0(底部)到34(顶部)。 这是我的代码:
library(ggplot2)

df <- data.frame(Depth_cm = c(5, 10, 15, 20, 25, 30, 35, 40, 45, 50, 55, 60, 65, 70, 75, 80, 85, 90, 95, 100, 105, 110, 115, 120, 125, 130, 135, 140, 145, 150, 155, 160, 165, 170, 175, 180, 185, 190, 195, 200, 205, 210, 215, 220, 225, 230, 235, 240, 245, 250, 255, 260, 265, 270, 275, 280, 285, 290, 295, 300, 305, 310
),
Year = c(1859, 1712, 1565, 1418, 1272, 1125, 978, 831, 684, 537, 244, -49, -343, -636, -929, -1222, -1516, -1809, -2102, -2280, -2458, -2636, -2814, -2992, -3170, -3348, -3527, -3705, -3883, -4061, -4239, -4417, -4840, -5262, -5685, -6108, -6530, -6953, -7376, -7798, -8221, -8644, -9066, -9489, -9912, -10334, -10757, -11180, -11603, -12025, -12448, -12871, -13293, -13716, -14139, -14561, -14984, -15407, -15829, -16252, -16675, -17097),
Incertainity = c(66, 66, 66, 66, 66, 66, 66, 66, 66, 115, 115, 115, 115, 115, 115, 115, 115, 115, 149, 149, 149, 149, 149, 149, 149, 149, 149, 149, 149, 149, 149, 133, 133, 133, 133, 133, 133, 133, 133, 133, 133, 133, 133, 133, 133, 133, 133, 133, 133, 133, 133, 133, 133, 133, 133, 133, 133, 133, 133, 133, 133, 133),
Rate = c(34, 34, 34, 34, 34, 34, 34, 34, 34, 17, 17, 17, 17, 17, 17, 17, 17, 17, 28, 28, 28, 28, 28, 28, 28, 28, 28, 28, 28, 28, 28, 12, 12, 12, 12, 12, 12, 12, 12, 12, 12, 12, 12, 12, 12, 12, 12, 12, 12, 12, 12, 12, 12, 12, 12, 12, 12, 12, 12, 12, 12, 12))


ggplot(df, aes(x = Year, y = Depth_cm)) +
  geom_ribbon(aes(xmin = Year - Incertainity, xmax = Year + Incertainity), alpha = 0.6, fill = "green3", size = 1) +
  geom_line(aes(linetype = ifelse((Year >= 2006 & Year <= 537) | (Year >= -13716 & Year <= -17097), "solid", "dotted"))) +
  geom_point(data = df[df$Year %in% c(537, -2102, -4417, -13716),], shape = "triangle", color = "red3", size = 2) +
  geom_line(aes(y = (Rate*10)))+
  scale_y_continuous(name = "Depth", sec.axis = sec_axis(~ . /10, name = "Sedimentation rate (cm/kyr)", breaks = seq(0, 34, by = 2))) +
  scale_x_continuous(name = "Year (AD/BC)", limits = c(-17500, 2100), breaks = seq(-17500, 2100, by = 1500)) +
  labs(x = "Year (AD/BC)", y = "Depth (cm)") +
  guides(linetype = FALSE) +
  theme_classic()

深度轴需要反转,但沉积速率轴不需要反转

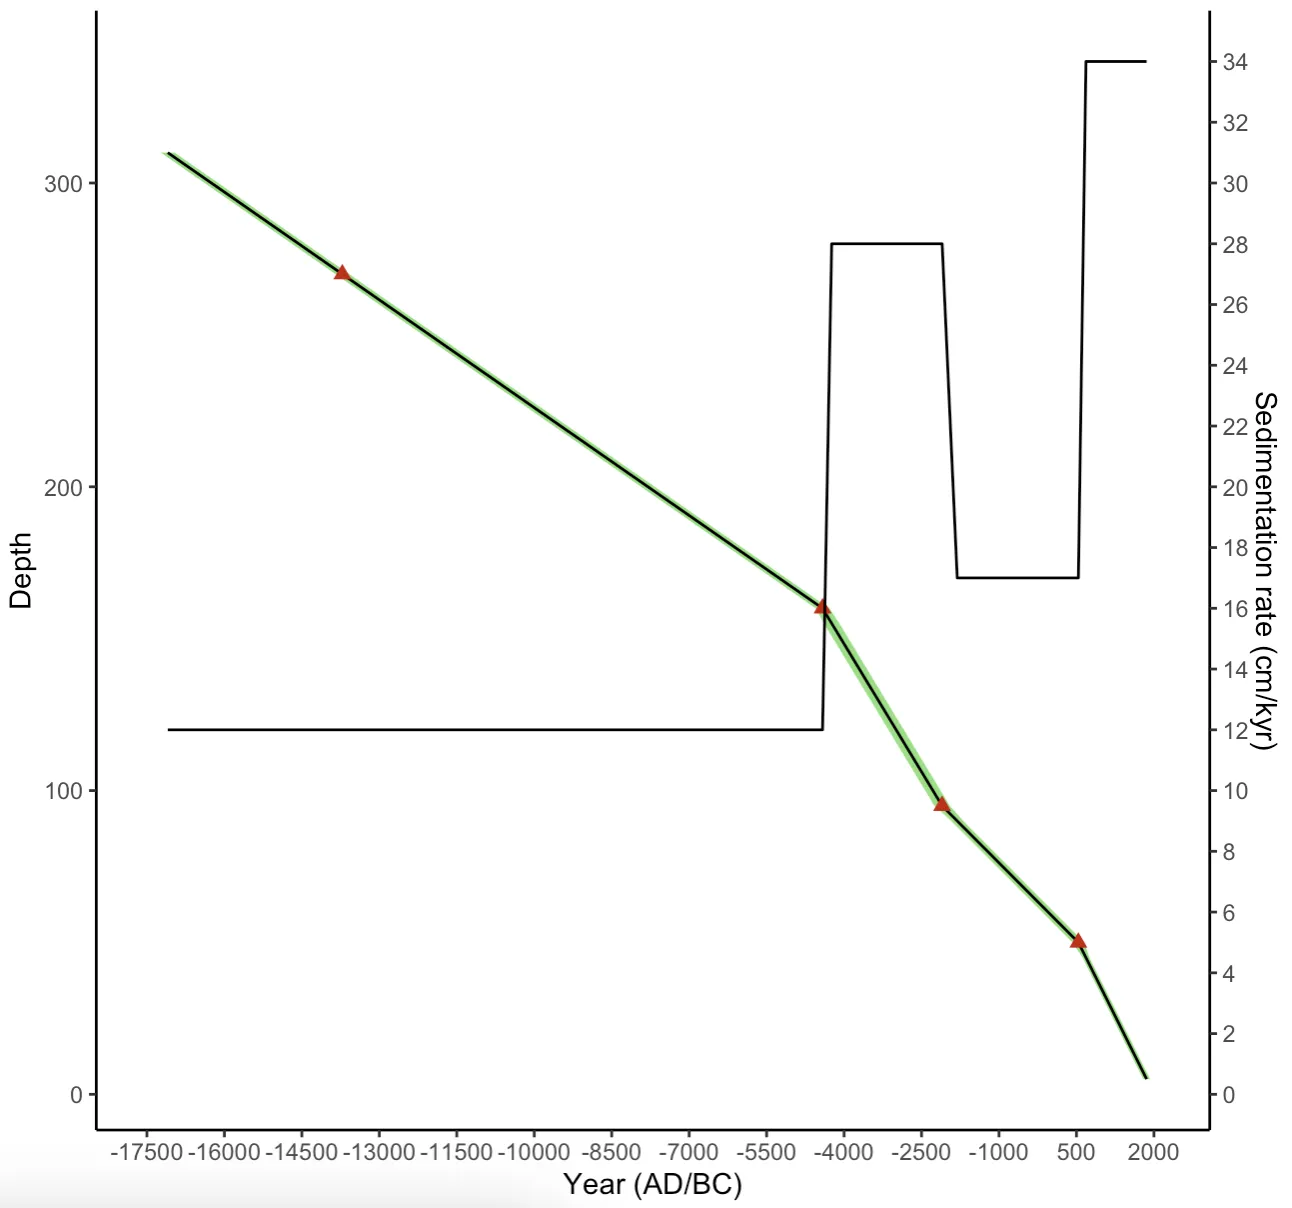
我尝试了scale_y_reverse函数,还尝试使用trans="reverse"。但这两个函数都会改变两个轴。

我只需要反转深度轴。

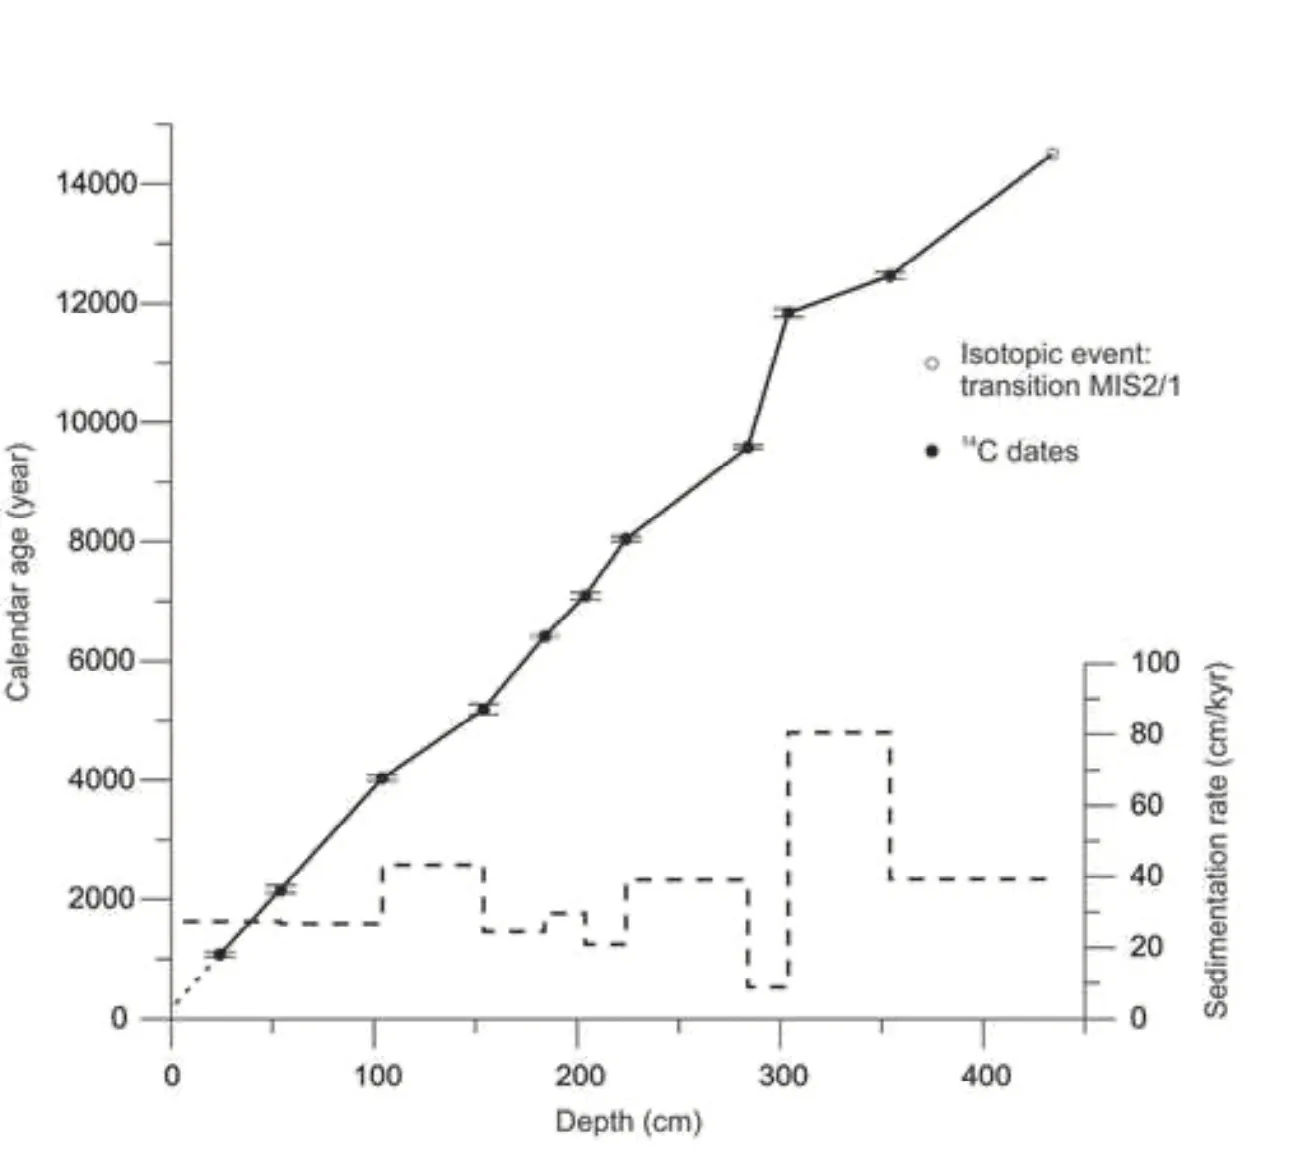
另外,我不知道是否可能:我想让第二个y轴变小,就像图片上的那样。有没有相应的函数可以实现?我想要复制的绘图模型

2个回答

3
你可以通过在`scale_y_continuous`中提取偏移量来更改`labels`,如果我理解你的意思是这样的:
df <- data.frame(Depth_cm = c(5, 10, 15, 20, 25, 30, 35, 40, 45, 50, 55, 60, 65, 70, 75, 80, 85, 90, 95, 100, 105, 110, 115, 120, 125, 130, 135, 140, 145, 150, 155, 160, 165, 170, 175, 180, 185, 190, 195, 200, 205, 210, 215, 220, 225, 230, 235, 240, 245, 250, 255, 260, 265, 270, 275, 280, 285, 290, 295, 300, 305, 310 ), Year = c(1859, 1712, 1565, 1418, 1272, 1125, 978, 831, 684, 537, 244, -49, -343, -636, -929, -1222, -1516, -1809, -2102, -2280, -2458, -2636, -2814, -2992, -3170, -3348, -3527, -3705, -3883, -4061, -4239, -4417, -4840, -5262, -5685, -6108, -6530, -6953, -7376, -7798, -8221, -8644, -9066, -9489, -9912, -10334, -10757, -11180, -11603, -12025, -12448, -12871, -13293, -13716, -14139, -14561, -14984, -15407, -15829, -16252, -16675, -17097), Incertainity = c(66, 66, 66, 66, 66, 66, 66, 66, 66, 115, 115, 115, 115, 115, 115, 115, 115, 115, 149, 149, 149, 149, 149, 149, 149, 149, 149, 149, 149, 149, 149, 133, 133, 133, 133, 133, 133, 133, 133, 133, 133, 133, 133, 133, 133, 133, 133, 133, 133, 133, 133, 133, 133, 133, 133, 133, 133, 133, 133, 133, 133, 133), Rate = c(34, 34, 34, 34, 34, 34, 34, 34, 34, 17, 17, 17, 17, 17, 17, 17, 17, 17, 28, 28, 28, 28, 28, 28, 28, 28, 28, 28, 28, 28, 28, 12, 12, 12, 12, 12, 12, 12, 12, 12, 12, 12, 12, 12, 12, 12, 12, 12, 12, 12, 12, 12, 12, 12, 12, 12, 12, 12, 12, 12, 12, 12))

library(ggplot2)
ggplot(df, aes(x = Year, y = Depth_cm)) + 
  geom_ribbon(aes(xmin = Year - Incertainity, xmax = Year + Incertainity), 
              alpha = 0.6, fill = "green3", size = 1) + 
  geom_line(aes(linetype = ifelse((Year >= 2006 & Year <= 537) | (Year >= -13716 & Year <= -17097), "solid", "dotted"))) + 
  geom_point(data = df[df$Year %in% c(537, -2102, -4417, -13716),], shape = "triangle", color = "red3", size = 2) + 
  geom_line(aes(y = (Rate*10)))+ 
  scale_y_continuous(name = "Depth", labels = function(x) abs(x - 300),
                     sec.axis = sec_axis(~ . /10, name = "Sedimentation rate (cm/kyr)", breaks = seq(0, 34, by = 2))) + 
  scale_x_continuous(name = "Year (AD/BC)", limits = c(-17500, 2100), breaks = seq(-17500, 2100, by = 1500)) + labs(x = "Year (AD/BC)", y = "Depth (cm)") + 
  guides(linetype = FALSE) + 
  theme_classic()

如果你想要添加更多的“breaks”,你可以像这样添加它们(在这里我还改变了“limits”和“offset”):
library(ggplot2)
ggplot(df, aes(x = Year, y = Depth_cm)) + 
  geom_ribbon(aes(xmin = Year - Incertainity, xmax = Year + Incertainity), 
              alpha = 0.6, fill = "green3", size = 1) + 
  geom_line(aes(linetype = ifelse((Year >= 2006 & Year <= 537) | (Year >= -13716 & Year <= -17097), "solid", "dotted"))) + 
  geom_point(data = df[df$Year %in% c(537, -2102, -4417, -13716),], shape = "triangle", color = "red3", size = 2) + 
  geom_line(aes(y = (Rate*10)))+ 
  scale_y_continuous(name = "Depth", 
                     labels = function(x) abs(x - 310), limits = c(0, 310),
                     breaks = seq(0, 310, by = 10),
                     sec.axis = sec_axis(~ . /10, name = "Sedimentation rate (cm/kyr)", breaks = seq(0, 34, by = 2))) + 
  scale_x_continuous(name = "Year (AD/BC)", limits = c(-17500, 2100), breaks = seq(-17500, 2100, by = 1500)) + labs(x = "Year (AD/BC)", y = "Depth (cm)") + 
  guides(linetype = FALSE) + 
  theme_classic()

2023-06-29创建,使用reprex v2.0.2生成


谢谢你的回答。两个轴的顺序都是正确的。然而,绿线数据需要与深度轴一样进行反转。例如:深度0厘米对应2000年,深度310厘米对应-17000年。有没有办法修复这个问题? - Mlp
谢谢你的回答。两个轴的顺序都是正确的。然而,绿线数据需要与深度轴一样进行反转。例如:深度0厘米对应于2000年,深度310厘米对应于-17000年。有没有办法修复这个问题? - Mlp
1
嗨 @Mlp,你可以尝试将你的 y 轴改为 y = rev(Depth_cm) - Quinten
1
嗨 @Mlp,你可以尝试将你的y轴改为 y = rev(Depth_cm) - Quinten
现在它完美运行!非常感谢你! - Mlp
现在它完美地运行了!非常感谢你! - Mlp

0
感谢两位贡献者,最终的代码和结果如下: (数据仍然可在初始问题帖中找到)
ggplot(df, aes(x = Year, y = rev(Depth_cm))) +  geom_ribbon(aes(xmin = Year - Incertainity, xmax = Year + Incertainity), alpha = 0.6, fill = "green3", size = 1) +  geom_line(aes(linetype = ifelse((Year >= 2006 & Year <= 537) | (Year >= -13716 & Year <= -17097), "solid", "dotted"))) + #geom_point(data = df[df$Year %in% c(-13716,-4417 , -2102,  537),], shape = "triangle", color = "red3", size = 2) +  geom_line(aes(y = (Rate/.35)))+   scale_y_continuous(name = "Depth (cm)", labels = function(x) abs(x - 300), sec.axis = sec_axis(~ . *0.35, name = "Sedimentation rate (cm/kyr)", breaks = seq(0, 34, by = 6))) + scale_x_continuous(name = "Year (AD/BC)", limits = c(-17500, 2100), breaks = seq(-17500, 2100, by = 1500)) + labs(x = "Year (AD/BC)", y = "Depth (cm)") + guides(linetype = FALSE) +  theme_classic()

Final plot


网页内容由stack overflow 提供, 点击上面的
可以查看英文原文,
原文链接