使用ggplot2在词云图中绘制子区域

3

我正在尝试从名为data的数据框中绘制这些国家:

               country value        lon        lat
1              Denmark    12   9.501785  56.263920
2     UK:Great Britain    13  -1.174320  52.355518
3               France    15   2.213749  46.227638
4              Germany    17  10.451526  51.165691
5      China:Hong Kong    18 114.174695  22.278315
6          Netherlands    31   5.291266  52.132633
7          New Zealand    32 174.885971 -40.900557
8  UK:Northern Ireland    33  -6.492314  54.787715
9               Norway    34   8.468946  60.472024
10        Saudi Arabia    40  45.079162  23.885942
11              Serbia    41  21.005859  44.016521
12           Singapore    42 103.819836   1.352083
13     Slovak Republic    43 101.724578   3.153870
14            Slovenia    44  14.995463  46.151241
15        South Africa    45  22.937506 -30.559482

我正在使用worldmap和ggplot库:

library(maps)       # Provides functions that let us plot the maps
library(ggplot2)    # Generic graphis engine

map = map_data("world")
map = subset(map, region!="Antarctica") #Remove Antarctica from map

Countries = ggplot() + 
  geom_polygon(data = map, aes(x=long, y = lat, group = group), fill = NA, colour="darkgray", size=0.5)+
  geom_map(data=data,map=map,aes(map_id=country, x=lon, y=lat),fill = "cornflowerblue", colour = "gray") +
  coord_equal()
Countries

我可以绘制除了 UK:Great Britain, China: Hong Kong 以及所有其他的区域和子区域都用 ":" 分隔的国家地图:

Country map

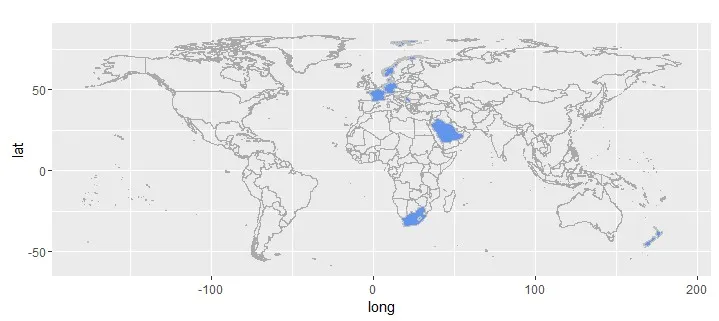
我不知道如何使用 world_map 和 ggplot 绘制 UK:Great Britain 的地图。你们有没有遇到类似的问题或者有解决方案?谢谢。


愚蠢的解决方案(但有效):将地图数据保存到txt文件中,使用
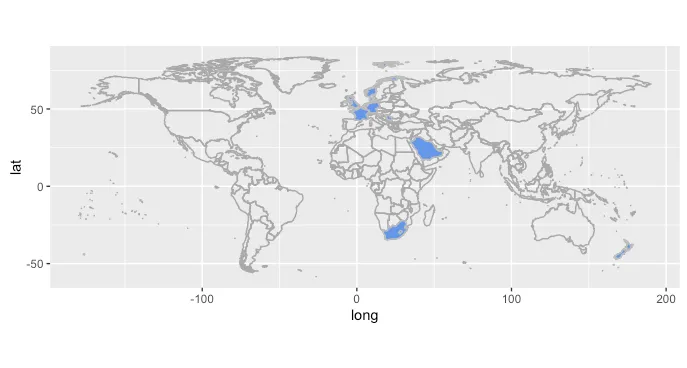
map = map_data("world") map = subset(map, region!="Antarctica") write.table(map, "C:/temp/map.txt", sep=";")。然后在Excel中连接区域和子区域列(其中子区域不为NA),并将保存的CSV文件重新导入R中。map <- read.csv("c:/Temp/map.csv", sep=";") - JPMD
为什么在R @JPMD之外concat起作用?而“起作用”是指什么? - hrbrmstr
我的意思是,我已经绘制出了我想要的国家。我更习惯于使用Excel... 我在R方面仍然是个新手... - JPMD
2个回答

3
这可以达到你想要的结果,但我不确定它是一个非常有用的地图。
library(ggplot2)
library(data.table)
library(magrittr)

map_dat <- subset(map_data("world"), region!="Antarctica")
setDT(map_dat)

# the countries you need to translate to region:subregion
colon_countries <-
  grep(':', data$country, value=T) %>%
    sub(':.*$', '', .) %>%
    unique

# change region to region:subregion, 
# for countries of interest, for rows with a value of subregion
map_dat[region %in% colon_countries, 
        region := ifelse(!is.na(subregion),
                         paste0(region, ':', subregion),
                         region)]
ggplot() + 
  geom_polygon(data = map_dat,
               aes(x=long, y = lat, group = group),
               fill = NA, colour="darkgray", size=0.5)+
  geom_map(data = data, map = map_dat,
           aes(map_id = country),
           fill = "cornflowerblue", colour = 'gray') +
  # probably not the projection you really want, but leaving it to match your post above
  coord_equal()

enter image description here


非常感谢@arvi1000。我不熟悉´library(data.table)´和´library(magrittr)´。你所说的“不是你真正想要的投影”是什么意思...是否有更适合世界地图的投影方式?(墨卡托?)。干杯。 - JPMD
data.table只是为了更方便地对行子集执行区域和子区域的连接操作;magrittr允许您使用管道运算符(%>%),从而使嵌套函数更易读(grep() %>% sub() %>% uniqueunique(sub(grep()))相同)。 - arvi1000
地图投影是一个有争议和个人偏好的问题(http://xkcd.com/977/)。`coord_map()`让你可以从多个常见选项中选择(默认包括墨卡托投影),但我发现使用该数据集会导致一些奇怪的伪影,这是因为多边形跨越国际日期线。尝试不同的方法,看看哪种适合你! - arvi1000

0

geom_map将匹配data$country中的条目与map$region相对应。不幸的是,map_data通过第一个冒号来分割地区,因此您会得到“UK”,而这与data$country中的“UK:Great Britain”不匹配。

一种可能的手动修复方法是进行如下更正:

map$region[which(map$subregion == "Great Britain")] <- "UK:Great Britain"
map$region[which(map$subregion == "Northern Ireland")] <- "UK:Northern Ireland"
map$region[which(map$subregion == "Hong Kong")] <- "China:Hong Kong"

1
实际上,arvi1000之前的回答基本上以稍微更一般化的方式给出了相同的解决方案。 - Alex Deckmyn
答案不太清楚。您能否提供完整的代码并包含答案?谢谢。 - aaaaa

网页内容由stack overflow 提供, 点击上面的
可以查看英文原文,
原文链接