如何使用pandas计算所有列之间的相关性并删除高度相关的列?

87

在进行机器学习建模之前,建议先移除高度相关的特征列。如何计算列间的相关性并删除相关性阈值大于0.8的列或描述符?同时保留缩减后数据集的表头。以下是一个数据集示例:

 GA      PN       PC     MBP      GR     AP   
0.033   6.652   6.681   0.194   0.874   3.177    
0.034   9.039   6.224   0.194   1.137   3.4      
0.035   10.936  10.304  1.015   0.911   4.9      
0.022   10.11   9.603   1.374   0.848   4.566    
0.035   2.963   17.156  0.599   0.823   9.406    
0.033   10.872  10.244  1.015   0.574   4.871     
0.035   21.694  22.389  1.015   0.859   9.259     
0.035   10.936  10.304  1.015   0.911   4.5       

请帮忙....


Feature-Engine具有内置的DropCorrelatedFeatures()转换器,可以为您完成繁重的工作,并且与sklearn兼容。 features_to_drop_属性显示它将删除哪些内容。 - kevin_theinfinityfund
相关:这个答案在pandas中实现了R的findCorrelation函数。它识别相关的列并返回除一个之外的所有标签。这里的现有答案会删除所有相关的列,这意味着会删除太多的列。 - undefined
28个回答

3

首先,感谢TomDobbs和Synergix提供的代码。下面是我分享的修改版本,增加了一些内容:

  1. 对于两个相关变量,该函数会删除与目标变量相关性最小的变量
  2. 添加了一些有用的日志记录(将verbose设置为True以打印日志)
def remove_collinear_features(df_model, target_var, threshold, verbose):
    '''
    Objective:
        Remove collinear features in a dataframe with a correlation coefficient
        greater than the threshold and which have the least correlation with the target (dependent) variable. Removing collinear features can help a model 
        to generalize and improves the interpretability of the model.

    Inputs: 
        df_model: features dataframe
        target_var: target (dependent) variable
        threshold: features with correlations greater than this value are removed
        verbose: set to "True" for the log printing

    Output: 
        dataframe that contains only the non-highly-collinear features
    '''

    # Calculate the correlation matrix
    corr_matrix = df_model.drop(target_var, 1).corr()
    iters = range(len(corr_matrix.columns) - 1)
    drop_cols = []
    dropped_feature = ""

    # Iterate through the correlation matrix and compare correlations
    for i in iters:
        for j in range(i+1): 
            item = corr_matrix.iloc[j:(j+1), (i+1):(i+2)]
            col = item.columns
            row = item.index
            val = abs(item.values)

            # If correlation exceeds the threshold
            if val >= threshold:
                # Print the correlated features and the correlation value
                if verbose:
                    print(col.values[0], "|", row.values[0], "|", round(val[0][0], 2))
                col_value_corr = df_model[col.values[0]].corr(df_model[target_var])
                row_value_corr = df_model[row.values[0]].corr(df_model[target_var])
                if verbose:
                    print("{}: {}".format(col.values[0], np.round(col_value_corr, 3)))
                    print("{}: {}".format(row.values[0], np.round(row_value_corr, 3)))
                if col_value_corr < row_value_corr:
                    drop_cols.append(col.values[0])
                    dropped_feature = "dropped: " + col.values[0]
                else:
                    drop_cols.append(row.values[0])
                    dropped_feature = "dropped: " + row.values[0]
                if verbose:
                    print(dropped_feature)
                    print("-----------------------------------------------------------------------------")

    # Drop one of each pair of correlated columns
    drops = set(drop_cols)
    df_model = df_model.drop(columns=drops)

    print("dropped columns: ")
    print(list(drops))
    print("-----------------------------------------------------------------------------")
    print("used columns: ")
    print(df_model.columns.tolist())

    return df_model

1
用"is"替换"=="比较布尔值是否安全? - Smart Manoj
如果我们在计算目标和特征之间的相关值时添加abs()函数,就不会看到负相关值。这一点很重要,因为当我们有负相关代码时会降低具有较强负相关值的小型代码。 /// col_corr = abs(df_model[col.values[0]].corr(df_model[target_var])) - Yiğit Can Taşoğlu

2

如果由于pandas .corr()导致内存不足,您可能会发现以下解决方案有用:

    import numpy as np 
    from numba import jit
    
    @jit(nopython=True)
    def corr_filter(X, threshold):
        n = X.shape[1]
        columns = np.ones((n,))
        for i in range(n-1):
            for j in range(i+1, n):
                if columns[j] == 1:
                    correlation = np.abs(np.corrcoef(X[:,i], X[:,j])[0,1])
                    if correlation >= threshold:
                        columns[j] = 0
        return columns
    
    columns = corr_filter(df.values, 0.7).astype(bool) 
    selected_columns = df.columns[columns]

你好!欢迎来到SO。感谢您的贡献!这里有一个关于如何分享您的知识的指南:https://stackoverflow.blog/2011/07/01/its-ok-to-ask-and-answer-your-own-questions/ - Bedir Yilmaz

1

这个问题有三个挑战。首先,如果特征x和y之间存在关联,你不想使用一个会同时删除它们俩的算法。其次,如果x和y两两之间存在关联,而且特征y和z也是两两相关的,你希望算法只删除y。从这个意义上说,你希望它删除最少数量的特征,以便没有剩余特征的相关性超过你的阈值。第三,从效率的角度来看,你不想多次计算相关矩阵。

以下是一种选择:

def corr_cleaner(df,corr_cutoff):
    '''
    df: pandas dataframe with column headers.
    corr_cutoff: float between 0 and 1.
    '''
    abs_corr_matrix = df.corr().abs()
    filtered_cols = []
    while True:
        offenders = []
        for i in range(len(abs_corr_matrix)):
            for j in range(len(abs_corr_matrix)):
                if i != j:
                    if abs_corr_matrix.iloc[i,j] > corr_cutoff:
                        offenders.append(df.columns[i])

        if len(offenders) > 0: # if at least one high correlation remains
            c = Counter(offenders)
            worst_offender = c.most_common(1)[0][0]  # var name of worst offender
            del df[worst_offender]
            filtered_cols.append(worst_offender)
            abs_corr_matrix.drop(worst_offender, axis=0, inplace=True) #drop from x-axis
            abs_corr_matrix.drop(worst_offender, axis=1, inplace=True) #drop from y-axis
        else: # if no high correlations remain, break
            break

    return df, filtered_cols

1
如果您想返回相关列的细分情况,您可以使用此函数来查看它们,以了解您要删除的内容并调整您的阈值。
def corr_cols(df,thresh):
    # Create correlation matrix
    corr_matrix = df.corr().abs()
    # Select upper triangle of correlation matrix
    upper = corr_matrix.where(np.triu(np.ones(corr_matrix.shape), k=1).astype(np.bool_))

    dic = {'Feature_1':[],'Featur_2':[],'val':[]}
    for col in upper.columns:
        corl = list(filter(lambda x: x >= thresh, upper[col] ))
        #print(corl)
        if len(corl) > 0:
            inds = [round(x,4) for x in corl]
            for ind in inds:
                #print(col)
                #print(ind)
                col2 = upper[col].index[list(upper[col].apply(lambda x: round(x,4))).index(ind)]
                #print(col2)
                dic['Feature_1'].append(col)
                dic['Featur_2'].append(col2)
                dic['val'].append(ind) 
    return pd.DataFrame(dic).sort_values(by="val", ascending=False)

然后通过调用 df 函数将它们移除。

    corr = corr_cols(star,0.5)
    df.drop(columns = corr.iloc[:,0].unique())

1

对用户3025698发布的解决方案进行了小幅修改,以解决未捕获第一列和第二列之间相关性以及一些数据类型检查的问题。

def filter_df_corr(inp_data, corr_val):
    '''
    Returns an array or dataframe (based on type(inp_data) adjusted to drop \
        columns with high correlation to one another. Takes second arg corr_val
        that defines the cutoff

    ----------
    inp_data : np.array, pd.DataFrame
        Values to consider
    corr_val : float
        Value [0, 1] on which to base the correlation cutoff
    '''
    # Creates Correlation Matrix
    if isinstance(inp_data, np.ndarray):
        inp_data = pd.DataFrame(data=inp_data)
        array_flag = True
    else:
        array_flag = False
    corr_matrix = inp_data.corr()

    # Iterates through Correlation Matrix Table to find correlated columns
    drop_cols = []
    n_cols = len(corr_matrix.columns)

    for i in range(n_cols):
        for k in range(i+1, n_cols):
            val = corr_matrix.iloc[k, i]
            col = corr_matrix.columns[i]
            row = corr_matrix.index[k]
            if abs(val) >= corr_val:
                # Prints the correlated feature set and the corr val
                print(col, "|", row, "|", round(val, 2))
                drop_cols.append(col)

    # Drops the correlated columns
    drop_cols = set(drop_cols)
    inp_data = inp_data.drop(columns=drop_cols)
    # Return same type as inp
    if array_flag:
        return inp_data.values
    else:
        return inp_data

1
这里的问题涉及到一个巨大的数据集。然而,我看到的所有答案都在处理数据帧。我提供了一个针对scipy稀疏矩阵的并行答案。与其返回一个巨大的相关矩阵,此方法会在检查所有字段的正负Pearson相关性后返回一个特征掩码以保留字段。
我还尝试使用以下策略最小化计算:
- 处理每列 - 从当前列+1开始,向右移动并计算相关性。 - 对于任何绝对值(correlation) >= 阈值的情况,标记当前列以进行删除,并且不再计算相关性。 - 对数据集中除最后一列之外的每列执行这些步骤。
通过保持全局被标记为删除的列的列表并跳过对这些列的进一步相关计算,这可能进一步加快速度,因为列将无序执行。但是,我不太了解python中的竞争条件,不能在今晚实现它。
显然,返回列掩码将允许代码处理比返回整个相关矩阵更大的数据集。
使用此函数检查每个列:
def get_corr_row(idx_num, sp_mat, thresh):
    # slice the column at idx_num
    cols = sp_mat.shape[1]
    x = sp_mat[:,idx_num].toarray().ravel()
    start = idx_num + 1
    
    # Now slice each column to the right of idx_num   
    for i in range(start, cols):
        y = sp_mat[:,i].toarray().ravel()
        # Check the pearson correlation
        corr, pVal = pearsonr(x,y)
        # Pearson ranges from -1 to 1.
        # We check both positive and negative correlations >= thresh using abs(corr)
        if abs(corr) >= thresh:
            # stop checking after finding the 1st correlation > thresh   
            return False
            # Mark column at idx_num for removal in the mask  
    return True  
    

同时运行列级相关性检查:

from joblib import Parallel, delayed  
import multiprocessing


def Get_Corr_Mask(sp_mat, thresh, n_jobs=-1):
    
    # we must make sure the matrix is in csc format 
    # before we start doing all these column slices!  
    sp_mat = sp_mat.tocsc()
    cols = sp_mat.shape[1]
    
    if n_jobs == -1:
        # Process the work on all available CPU cores
        num_cores = multiprocessing.cpu_count()
    else:
        # Process the work on the specified number of CPU cores
        num_cores = n_jobs

    # Return a mask of all columns to keep by calling get_corr_row() 
    # once for each column in the matrix     
    return Parallel(n_jobs=num_cores, verbose=5)(delayed(get_corr_row)(i, sp_mat, thresh)for i in range(cols))

General Usage:

#Get the mask using your sparse matrix and threshold.
corr_mask = Get_Corr_Mask(X_t_fpr, 0.95) 

# Remove features that are >= 95% correlated
X_t_fpr_corr = X_t_fpr[:,corr_mask]

0
我写了一个笔记本,使用了偏相关性。

https://gist.github.com/thistleknot/ce1fc38ea9fcb1a8dafcfe6e0d8af475

这是它的要点(意在双关)

for train_index, test_index in kfold.split(all_data):
    #print(iteration)
    max_pvalue = 1
    
    subset = all_data.iloc[train_index].loc[:, ~all_data.columns.isin([exclude])]
    
    #skip y and states
    set_ = subset.loc[:, ~subset.columns.isin([target])].columns.tolist()
    
    n=len(subset)
    
    while(max_pvalue>=.05):

        dist = scipy.stats.beta(n/2 - 1, n/2 - 1, loc=-1, scale=2)
        p_values = pd.DataFrame(2*dist.cdf(-abs(subset.pcorr()[target]))).T
        p_values.columns = list(subset.columns)
        
        max_pname = p_values.idxmax(axis=1)[0]
        max_pvalue = p_values[max_pname].values[0]
        
        if (max_pvalue > .05):

            set_.remove(max_pname)
            temp = [target]
            temp.extend(set_)
            subset = subset[temp]
    
    winners = p_values.loc[:, ~p_values.columns.isin([target])].columns.tolist()
    sig_table = (sig_table + np.where(all_data.columns.isin(winners),1,0)).copy()
    
    signs_table[all_data.columns.get_indexer(winners)]+=np.where(subset.pcorr()[target][winners]<0,-1,1)


significance = pd.DataFrame(sig_table).T
significance.columns = list(all_data.columns)
display(significance)

sign = pd.DataFrame(signs_table).T
sign.columns = list(all_data.columns)
display(sign)

purity = abs((sign/num_folds)*(sign/significance)).T.replace([np.inf, -np.inf, np.NaN], 0)
display(purity.T)

0
以下代码段递归地删除最相关的特征。
def get_corr_feature(df):
    corr_matrix = df.corr().abs()
    # Select upper triangle of correlation matrix
    upper = corr_matrix.where(np.triu(np.ones(corr_matrix.shape), k=1).astype(np.bool_))
    upper['score']= upper.max(axis=1)
    upper.sort_values(by=['score'],ascending=False)
    #Find the most correlated feature and send return it for drop
    column_name=upper.sort_values(by=['score'],ascending=False).index[0]
    max_score=upper.loc[column_name,'score']
    return column_name, max_score

max_score=1
while max_score>0.5:
    column_name, max_score=get_corr_feature(df)
    df.drop(column_name,axis=1,inplace=True)

0

我用这种方式成功地做到了。请尝试一下。然而,我所做的方式只是为了达到显示的目的,因为我想在报告中捕获结果。如果你想删除它,你可以从下面的数据框中选择任何列来删除,因为只能选择其中一个。

row_index = 0
corrDict = {}
row_name = []
col_name = []
corr_val = []

while row_index < len(df.corr().index.tolist()):
    for index, x in enumerate(df.corr().iloc[row_index, :]):
        if abs(x) >= 0.8 and index != row_index:
            if abs(x) in corr_val:
                if (df.corr().index.tolist()[row_index] in col_name) and (df.corr().columns.tolist()[index] in row_name):
                    continue
            row_name.append(df.corr().index.tolist()[row_index])
            col_name.append(df.corr().columns.tolist()[index])
            corr_val.append(x)
    row_index += 1
    
corrDict ={"First Feature (FF)": row_name, "Second Feature (SF)": col_name, "Correlation (FF x SF)": corr_val}
corr_df2=pd.DataFrame(corrDict)
corr_df2

这是我的输出:

enter image description here

你可以选择第一个特征(FF)或第二个特征(SF)。 从原始数据集中删除高度相关的特征:
your_df.drop(corr_df2['First Feature (FF)'].tolist(), axis=1, inplace=True)

0
你可以使用以下函数,它还会将元素排序:
def correlation(dataset, threshold = 0.3):
  c = dataset.corr().abs()
  s = c.unstack()
  so = s.sort_values(kind="quicksort")
  results = []
  for index, row in so.items():
    if index[0] != index[1] and row > threshold:
      results.append({index: row})
  return results

您可以按照以下方式调用函数,发送您想要查找相关性和阈值的Pandas数据集:
highly_correlated_features = correlation(dataset=data_train_val_without_label, threshold=0.35)
highly_correlated_features

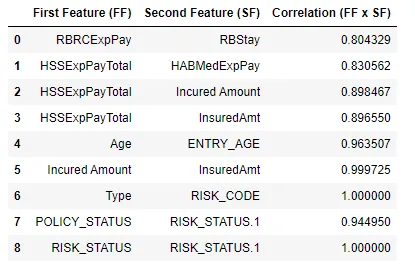
对于具有以下列和默认阈值的数据集,它将产生类似于这样的结果:

输入列

 0   HighBP                202944 non-null  float64
 1   HighChol              202944 non-null  float64
 2   CholCheck             202944 non-null  float64
 3   BMI                   202944 non-null  float64
 4   Smoker                202944 non-null  float64
 5   Stroke                202944 non-null  float64
 6   HeartDiseaseorAttack  202944 non-null  float64
 7   PhysActivity          202944 non-null  float64
 8   Fruits                202944 non-null  float64
 9   Veggies               202944 non-null  float64
 10  HvyAlcoholConsump     202944 non-null  float64
 11  AnyHealthcare         202944 non-null  float64
 12  NoDocbcCost           202944 non-null  float64
 13  GenHlth               202944 non-null  float64
 14  MentHlth              202944 non-null  float64
 15  PhysHlth              202944 non-null  float64
 16  DiffWalk              202944 non-null  float64
 17  Sex                   202944 non-null  float64
 18  Age                   202944 non-null  float64
 19  Education             202944 non-null  float64
 20  Income                202944 non-null  float64

输出:

[{('Income', 'Education'): 0.38083797089605675},
 {('Education', 'Income'): 0.38083797089605675},
 {('DiffWalk', 'PhysHlth'): 0.38145172573435343},
 {('PhysHlth', 'DiffWalk'): 0.38145172573435343},
 {('DiffWalk', 'GenHlth'): 0.385707943062701},
 {('GenHlth', 'DiffWalk'): 0.385707943062701},
 {('PhysHlth', 'GenHlth'): 0.3907082729122655},
 {('GenHlth', 'PhysHlth'): 0.3907082729122655}]

1
请考虑在答案中提供源代码的输出,这样用户就可以将其与问题陈述相对应。 - Azhar Khan

网页内容由stack overflow 提供, 点击上面的
可以查看英文原文,
原文链接