有没有Python中使用NARX模型进行训练和预测/推断数据的端到端示例?有一个名为PyNeurgen的库NARX PyNeurgen library,但是其文档不太完整。这个帖子似乎已经编写了一个Keras实现,但是代码缺少推断/预测的实现。NARX implementation using keras
Python中NARX的例子 - 涵盖训练和预测
3
- lightbox142
1
1顺便说一句,我找到了一个适用于sklearn的NARX实现的Github仓库https://github.com/jxx123/fireTS。它似乎缺少一些功能,但总体比PyNeurgen更好... - lightbox142
1个回答
4
我认为您正在寻找model.fit()和model.predict()的等效方法,它们在pyneurgen中分别为net.learn()和net.test()。基于这个教程和这个示例,我编写了这个演示(使用Python 2.7),以便让您了解如何实现它。希望对您有所帮助。
import math
import numpy as np
import matplotlib.pylab as plt
from pyneurgen.neuralnet import NeuralNet
from pyneurgen.recurrent import NARXRecurrent
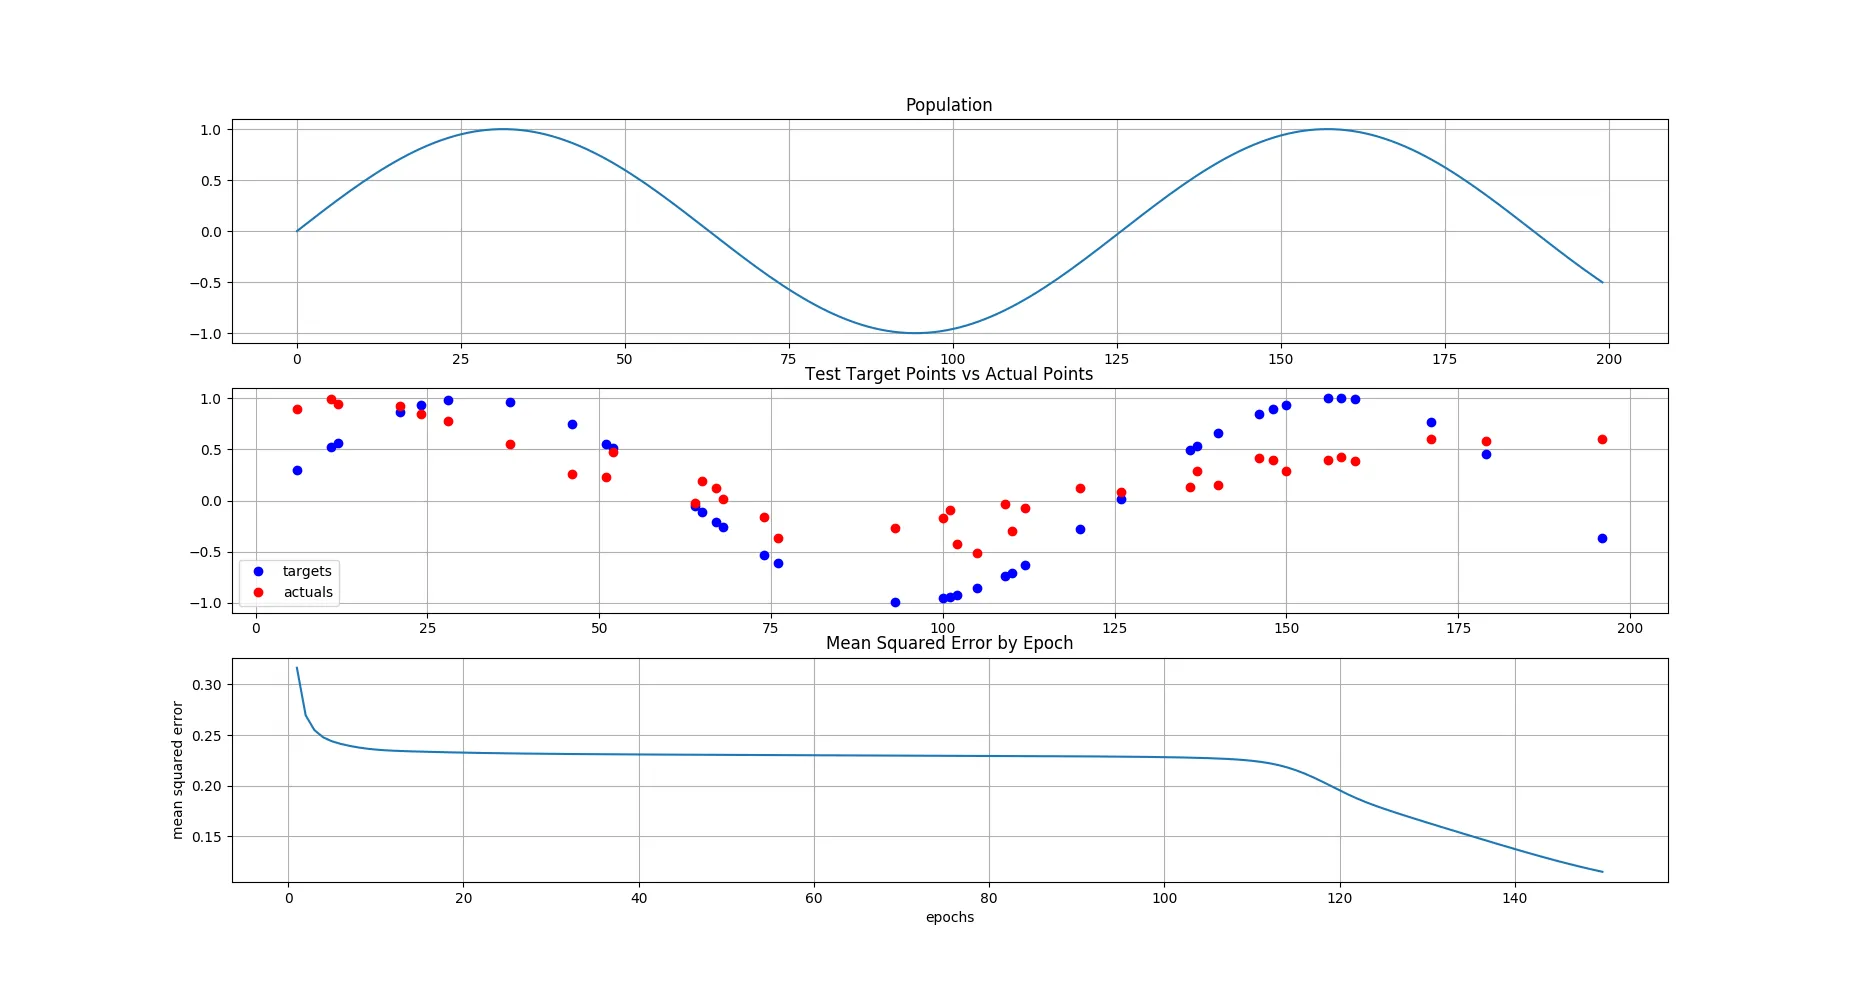
def plot_results(x, y, y_true):
plt.subplot(3, 1, 1)
plt.plot([i[1] for i in population])
plt.title("Population")
plt.grid(True)
plt.subplot(3, 1, 2)
plt.plot(x, y, 'bo', label='targets')
plt.plot(x, y_true, 'ro', label='actuals')
plt.grid(True)
plt.legend(loc='lower left', numpoints=1)
plt.title("Test Target Points vs Actual Points")
plt.subplot(3, 1, 3)
plt.plot(range(1, len(net.accum_mse) + 1, 1), net.accum_mse)
plt.xlabel('epochs')
plt.ylabel('mean squared error')
plt.grid(True)
plt.title("Mean Squared Error by Epoch")
plt.show()
def generate_data():
# all samples are drawn from this population
pop_len = 200
factor = 1.0 / float(pop_len)
population = [[i, math.sin(float(i) * factor * 10.0)] for i in range(pop_len)]
population_shuffle = population[:]
all_inputs = []
all_targets = []
np.random.shuffle(population_shuffle)
for position, target in population_shuffle:
all_inputs.append([position * factor])
all_targets.append([target])
# print(all_inputs[-1], all_targets[-1])
return population, all_inputs, all_targets
# generate data
population, all_inputs, all_targets = generate_data()
# NARXRecurrent
input_nodes, hidden_nodes, output_nodes = 1, 10, 1
output_order, incoming_weight_from_output = 3, .6
input_order, incoming_weight_from_input = 2, .4
# init neural network
net = NeuralNet()
net.init_layers(input_nodes, [hidden_nodes], output_nodes,
NARXRecurrent(output_order, incoming_weight_from_output,
input_order, incoming_weight_from_input))
net.randomize_network()
net.set_halt_on_extremes(True)
# set constrains and rates
net.set_random_constraint(.5)
net.set_learnrate(.1)
# set inputs and outputs
net.set_all_inputs(all_inputs)
net.set_all_targets(all_targets)
# set lengths
length = len(all_inputs)
learn_end_point = int(length * .8)
# set ranges
net.set_learn_range(0, learn_end_point)
net.set_test_range(learn_end_point + 1, length - 1)
# add activation to layer 1
net.layers[1].set_activation_type('tanh')
# fit data to model
net.learn(epochs=150, show_epoch_results=True, random_testing=False)
# define mean squared error
mse = net.test()
print "Testing mse = ", mse
# define data
x = [item[0][0] * 200.0 for item in net.get_test_data()]
y = [item[0][0] for item in net.test_targets_activations]
y_true = [item[1][0] for item in net.test_targets_activations]
# plot results
plot_results(x, y, y_true)
这导致以下图表:
更多示例,请查看以下链接:
- SuperKogito
3
net.test似乎只评估存储在net对象中的测试数据。我找不到任何内置方法来对新数据进行预测并返回该数据。 - lightbox142
@SuperKogito - 你为什么引用一个进化模型[空气质量],它以一种相当反模式的方式演变--从差到更差再到最差(均方误差不断增加)的预测能力 - 即在预测时显示出糟糕、更糟和最糟的错误结果?我错过了什么重要的东西吗? - user3666197
@user3666197 我只是引用它作为如何使用
net.learn()函数的粗略示例,但可能不是最好的例子。@tete123f 我进一步检查了文档,我同意你的观点,我找不到任何关于如何在样本上运行预测的提示。我想到的唯一的想法是使用net.set_all_inputs()和net.set_all_targets来传递新样本给训练好的网络,然后尝试使用net._evaluate()或其编辑版本返回预测结果,但我没有成功。也许你会更幸运。 - SuperKogito网页内容由stack overflow 提供, 点击上面的可以查看英文原文,
原文链接
原文链接