我希望根据某些组的统计数据,如平均值、标准差等,更改Altair图表的分面顺序。
在某些情况下,排序函数可能更复杂,例如两个移动平均数之间的差值、EWMA的斜率等,因此如果可能的话,我也想能够“传递”顺序。
这是可测试的代码:
import pandas as pd
import numpy as np
import altair as alt

alt.renderers.enable('notebook')

# make some data to test
N = 500
df = pd.DataFrame({
    'Date Time': pd.date_range('2019-06-19', periods=N, freq='H'),
    'A':  np.random.normal(6, 1, N),
    'B': np.random.normal(5, 1, N),
    'C': np.random.normal(7, 1, N),
    'D': np.random.normal(8, 1, N)
}).melt('Date Time')

# render the chart using facets
p = alt.Chart(df).mark_point().encode(
    facet='variable',
    y='value',
    x='Date Time',
    color='variable',
)

# set some aditional properties
p.properties(width=230, height=150, columns=3).resolve_scale()
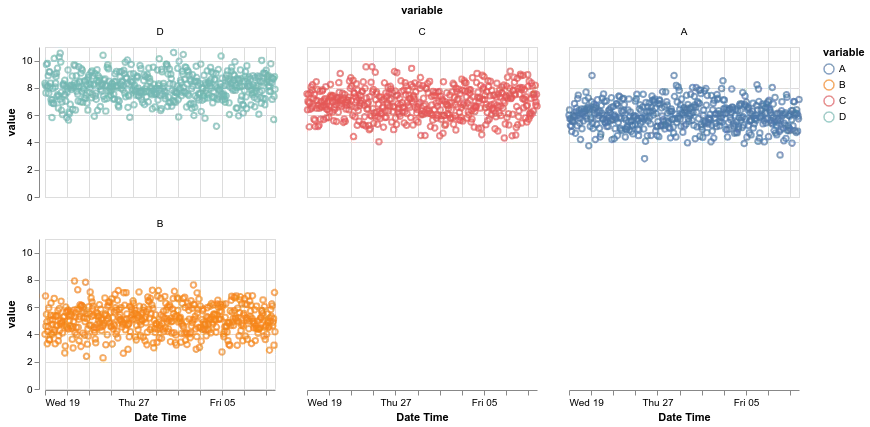
以下代码会生成这样一个图表,其中各个方块按字母顺序排序:
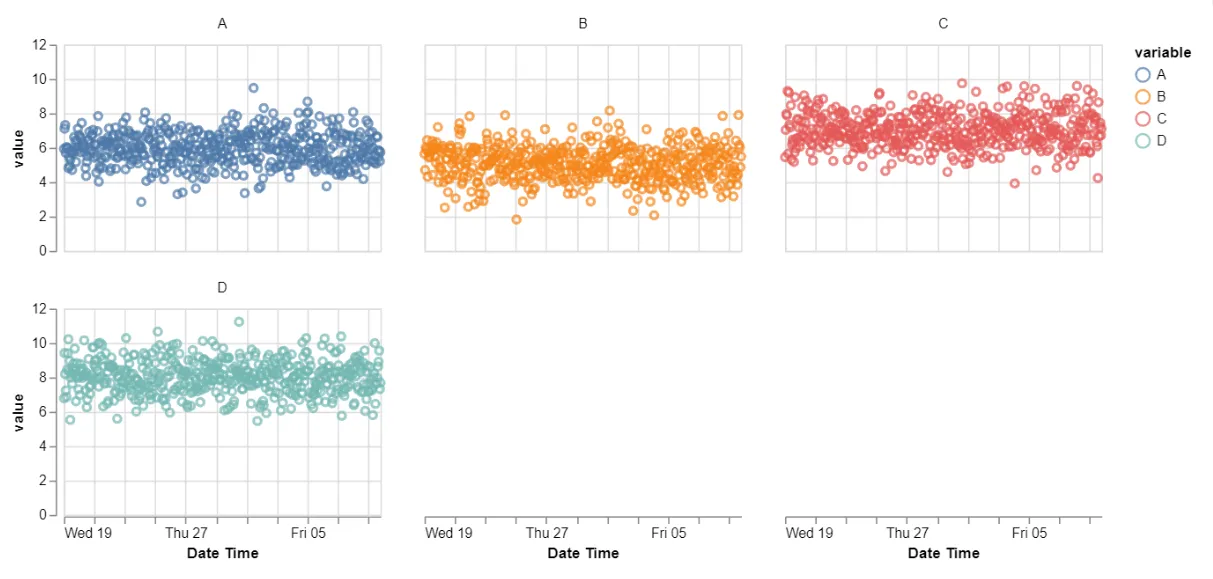
我希望排序方式是按平均值从大到小排序:
var_order = df.groupby('variable').mean().sort_values('variable', ascending=False).index.values
var_order
产生:
array(['D', 'C', 'B', 'A'], dtype=object)
我看到一些帖子表明在x和y上排序是可能的,但这种情况是我想要对面进行排序。