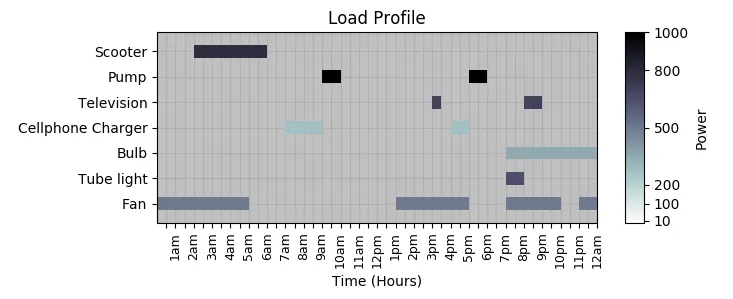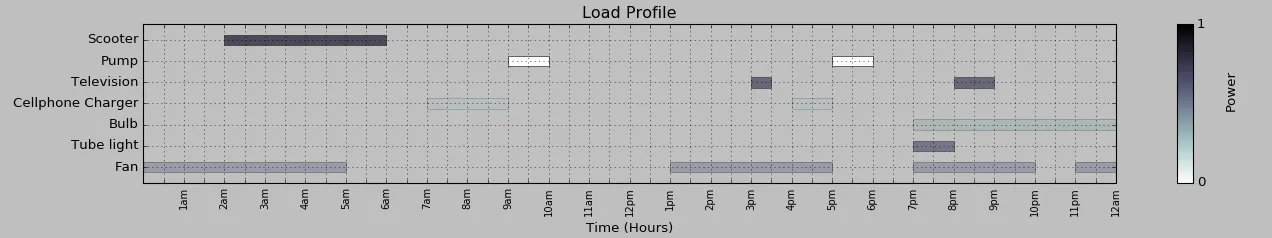
是我使用matplotlib创建的一个子图。是否可以根据预定义的范围编写颜色代码?我想向函数
drawLoadDuration传递一个额外的参数
voltage,并定义一个比例尺(使用if-else结构?)来设置颜色。电压越高,阴影越深。另外,由于某种原因,颜色条的y轴刻度标签没有显示出来。任何线索都非常欢迎......谢谢!
import matplotlib.cm
from pylab import *
import numpy as np
f, (ax1, ax2, ax3) = plt.subplots(3, sharex=True, sharey=False)
ax3.set_title('Load Profile')
ax3.patch.set_facecolor('silver')
ax3.grid(True)
cmap= plt.cm.bone_r
barHeight = 3
ticklist = []
def drawLoadDuration(period, starty, opacity):
ax3.broken_barh((period), (starty, barHeight), alpha=opacity, facecolors=cmap(opacity), lw=0.5, zorder=2)
ticklist.append(starty+barHeight/2.0)
return 0
drawLoadDuration([(0, 5), (13, 4), (19, 3), (23, 1)], 3, 0.5)
drawLoadDuration([(19, 1)], 9, 0.65)
drawLoadDuration([(19, 5)], 15, 0.35)
drawLoadDuration([(7, 2), (16, 1)], 21, 0.28)
drawLoadDuration([(15, 0.5), (20, 1)], 27, 0.7)
drawLoadDuration([(9, 1), (17, 1)], 33, 1)
drawLoadDuration([(2,4)], 39, 0.8)
ax3.set_ylim(0, 45)
ax3.set_xlim(0, 24)
ax3.set_xlabel('Time (Hours)')
ax3.set_yticks(ticklist)
xticklist = np.linspace(0.5, 24, 48)
ax3.set_xticks(xticklist)
ax3.set_xticklabels(["{}{}m".format(int(h%12+12*(h%12==0)),
{0:"p",1:"a"}[(h%24)<12]) if ((h*10)%10)==0 \
else "" for h in xticklist], fontsize='9', rotation=90)
ax3.tick_params('x', colors=cmap(1.0), tick1On=True)
ax3.set_yticklabels(['Fan', 'Tube light', 'Bulb', 'Cellphone Charger', 'Television', 'Pump', 'Scooter'])
sm = matplotlib.cm.ScalarMappable(cmap=cmap)
sm.set_array([])
cbar = f.colorbar(sm, ticks=[-3, -2, -1, 0, 1, 2, 3], aspect=10, orientation='vertical', ax=ax3)
cbar.ax.text(3, 0.65, 'Power', rotation=90)
cbar.ax.set_yticklabels(['>1000', '>800', '>500', '>200', '>100', '<10'])
plt.show()