我正在使用matplotlib中的HSV色图来绘制一些矢量场。有没有办法使HSV颜色变暗或更加平滑,使它们看起来更像这样: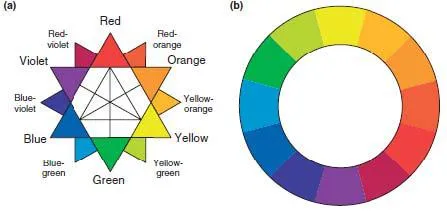 而不是我的原始绘图颜色太亮:
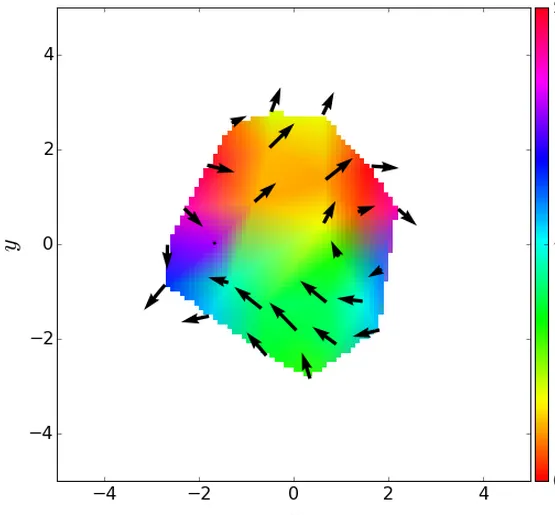
而不是我的原始绘图颜色太亮:
而不是我的原始绘图颜色太亮:
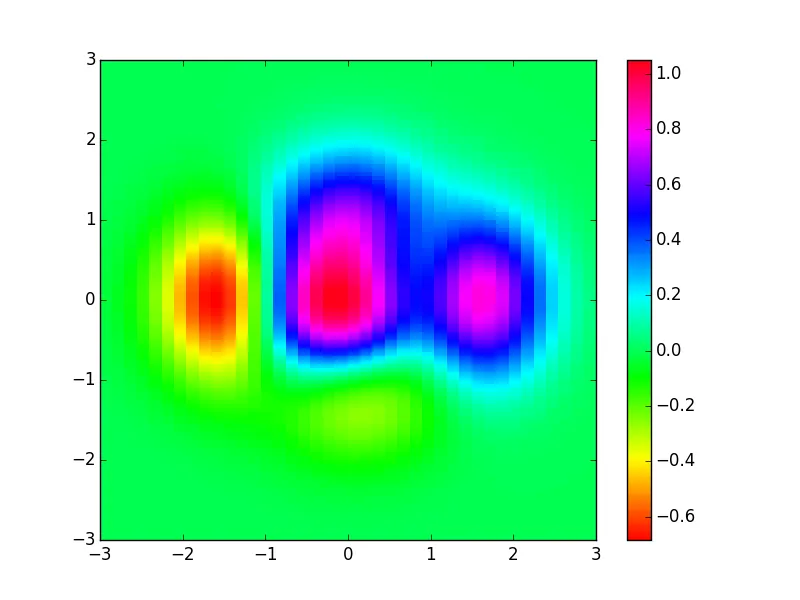
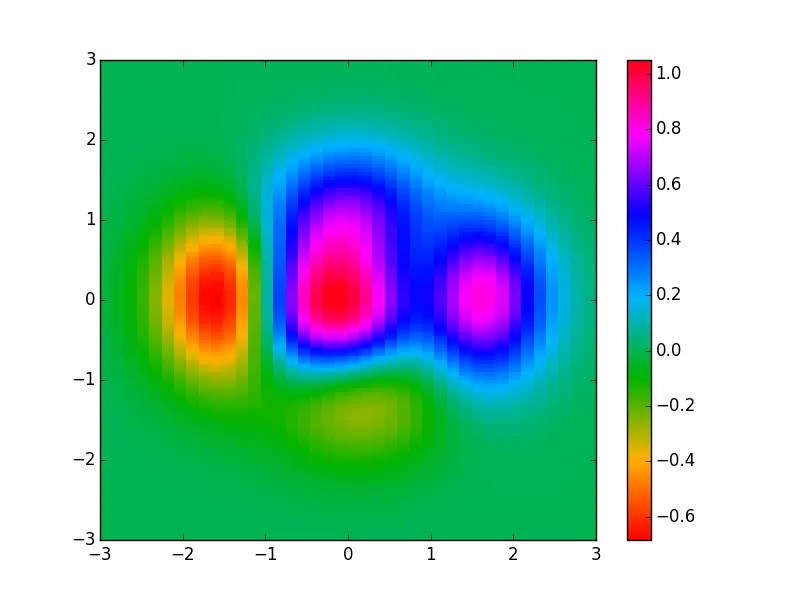
假设您正在尝试绘制类似于以下的pcolor图像:
import numpy as np
import matplotlib.pyplot as plt

y, x = np.mgrid[slice(-3, 3 + 0.05, 0.05),
                slice(-3, 3 + 0.15, 0.15)]
z = (1 - x / 2. + x ** 5 + y ** 3) * np.exp(-x ** 2 - y ** 2)
# x and y are bounds, so z should be the value *inside* those bounds.
# Therefore, remove the last value from the z array.
z = z[:-1, :-1]

fig = plt.figure(1)
fig.clf()
ax = plt.gca()
pcol = ax.pcolormesh(x, y, z, cmap=plt.get_cmap('hsv'), )
plt.colorbar(pcol)
ax.set_xlim([-3, 3])
ax.set_ylim([-3, 3])
您的图片将会是:
我编写了一个修改调色板的MPL cookbook cmap_map函数的替代实现。除了支持kwargs和pep8兼容性外,这个版本还处理了调色板中的不连续性:
import numpy as np
from matplotlib.colors import LinearSegmentedColormap as lsc


def cmap_map(function, cmap, name='colormap_mod', N=None, gamma=None):
    """
    Modify a colormap using `function` which must operate on 3-element
    arrays of [r, g, b] values.

    You may specify the number of colors, `N`, and the opacity, `gamma`,
    value of the returned colormap. These values default to the ones in
    the input `cmap`.

    You may also specify a `name` for the colormap, so that it can be
    loaded using plt.get_cmap(name).
    """
    if N is None:
        N = cmap.N
    if gamma is None:
        gamma = cmap._gamma
    cdict = cmap._segmentdata
    # Cast the steps into lists:
    step_dict = {key: map(lambda x: x[0], cdict[key]) for key in cdict}
    # Now get the unique steps (first column of the arrays):
    step_list = np.unique(sum(step_dict.values(), []))
    # 'y0', 'y1' are as defined in LinearSegmentedColormap docstring:
    y0 = cmap(step_list)[:, :3]
    y1 = y0.copy()[:, :3]
    # Go back to catch the discontinuities, and place them into y0, y1
    for iclr, key in enumerate(['red', 'green', 'blue']):
        for istp, step in enumerate(step_list):
            try:
                ind = step_dict[key].index(step)
            except ValueError:
                # This step is not in this color
                continue
            y0[istp, iclr] = cdict[key][ind][1]
            y1[istp, iclr] = cdict[key][ind][2]
    # Map the colors to their new values:
    y0 = np.array(map(function, y0))
    y1 = np.array(map(function, y1))
    # Build the new colormap (overwriting step_dict):
    for iclr, clr in enumerate(['red', 'green', 'blue']):
        step_dict[clr] = np.vstack((step_list, y0[:, iclr], y1[:, iclr])).T
    return lsc(name, step_dict, N=N, gamma=gamma)
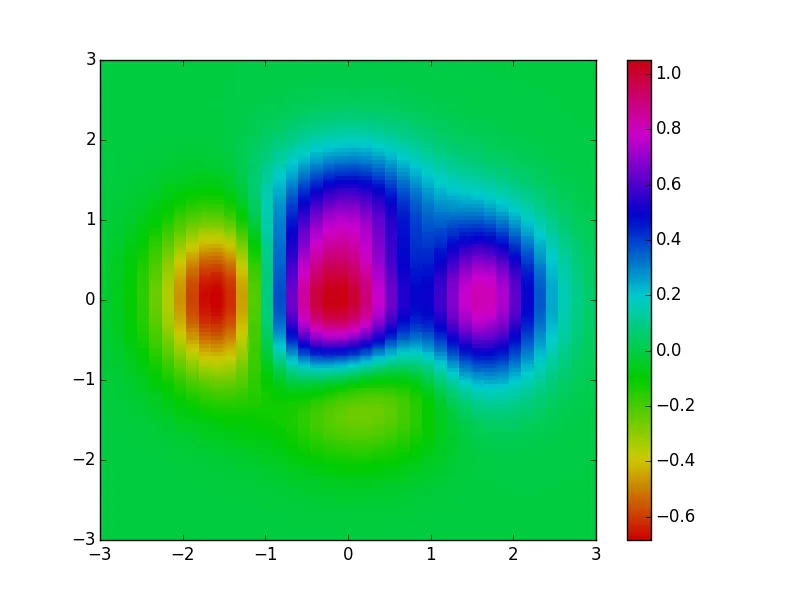
要使用它,只需定义一个函数来修改您想要的 RGB 颜色(0到1之间的值),并将其作为输入提供给 cmap_map。例如,要获得与您提供的图像中的颜色接近的颜色,您可以定义:
def darken(x, ):
   return x * 0.8

dark_hsv = cmap_map(darken, plt.get_cmap('hsv'))
然后修改对pcolormesh的调用:
pcol = ax.pcolormesh(x, y, z, cmap=dark_hsv)
pcol = ax.pcolormesh(x, y, z,
                     cmap=cmap_map(lambda x: x * [1, 0.7, 1],
                                   plt.get_cmap('hsv'))
                    )
plt.get_cmap('rainbow')更接近你想要的吗? - farenorth