应该可以像这样工作:
from matplotlib import pyplot
from matplotlib.colors import LinearSegmentedColormap
def create_cmap(data, colours, stops=None):
min_x = min(data)
max_x = max(data)
if stops is not None:
min_x = min(min_x, min(stops))
max_x = max(max_x, max(stops))
if stops is None:
d_x = (max_x - min_x)/(len(colours)-1)
stops = [min_x + i*d_x for i in range(len(colours))]
if min_x < min(stops):
stops = [min_x] + stops
colours = [colours[0]] + colours
if max_x > max(stops):
stops = stops + [max_x]
colours = colours + [colours[-1]]
stops = [(s-min_x)/(max_x-min_x) for s in stops]
cmap_data = list(zip(stops, colours))
cmap = LinearSegmentedColormap.from_list('continuous_map', cmap_data)
def cmap_wrapper(x):
x = max(min_x, min(x, max_x))
x_n = (x-min_x)/(max_x-min_x)
return cmap(x_n)
return cmap_wrapper
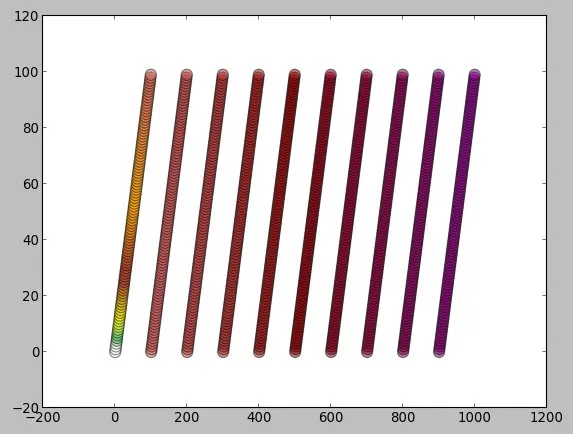
colours = ['xkcd:white', 'xkcd:darkgreen', 'xkcd:lightgreen', 'xkcd:yellow', 'xkcd:brown', 'xkcd:orange', 'xkcd:coral', 'xkcd:crimson', 'xkcd:purple']
stops = [0, 1, 5, 10, 25, 50, 100, 500, 1000]
cmap = create_cmap(stops, colours, stops=stops)
fig = pyplot.figure(figsize=(10,10))
ax = fig.add_subplot(1,1,1)
for y in range(1000):
ax.plot([0,1],[y,y],c=cmap(y))
pyplot.show()