我尝试使用Geopandas官方教程和这个数据集来绘制与Geopandas和Folium相对应的多边形。我尽量按照教程的字面意思进行操作,但是Folium仍然无法绘制多边形。Matplotlib地图可以正常工作,我也可以创建Folium地图。代码如下:
import pandas as pd
import geopandas as gdp
import folium
import matplotlib.pyplot as plt
df = pd.read_csv('https://geo.stat.fi/geoserver/wfs?service=WFS&version=2.0.0&request=GetFeature&typeName=postialue:pno_tilasto&outputFormat=csv')
df.to_csv('coordinates.csv')
#limit to Helsinki and drop unnecessary columns
df['population_2019'] = df['he_vakiy']
df['zipcode'] = df['postinumeroalue'].astype(int)
df['population_2019'] = df['population_2019'].astype(int)
df = df[df['zipcode'] < 1000]
df = df[['zipcode', 'nimi', 'geom', 'population_2019']]
df.to_csv('coordinates_hki.csv')
df.head()
#this is from there: https://gis.stackexchange.com/questions/387225/set-geometry-in-#geodataframe-to-another-column-fails-typeerror-input-must-be
from shapely.wkt import loads
df = gdp.read_file('coordinates_hki.csv')
df.geometry = df['geom'].apply(loads)
df.plot(figsize=(6, 6))
plt.show()
df = df.set_crs(epsg=4326)
print(df.crs)
df.plot(figsize=(6, 6))
plt.show()
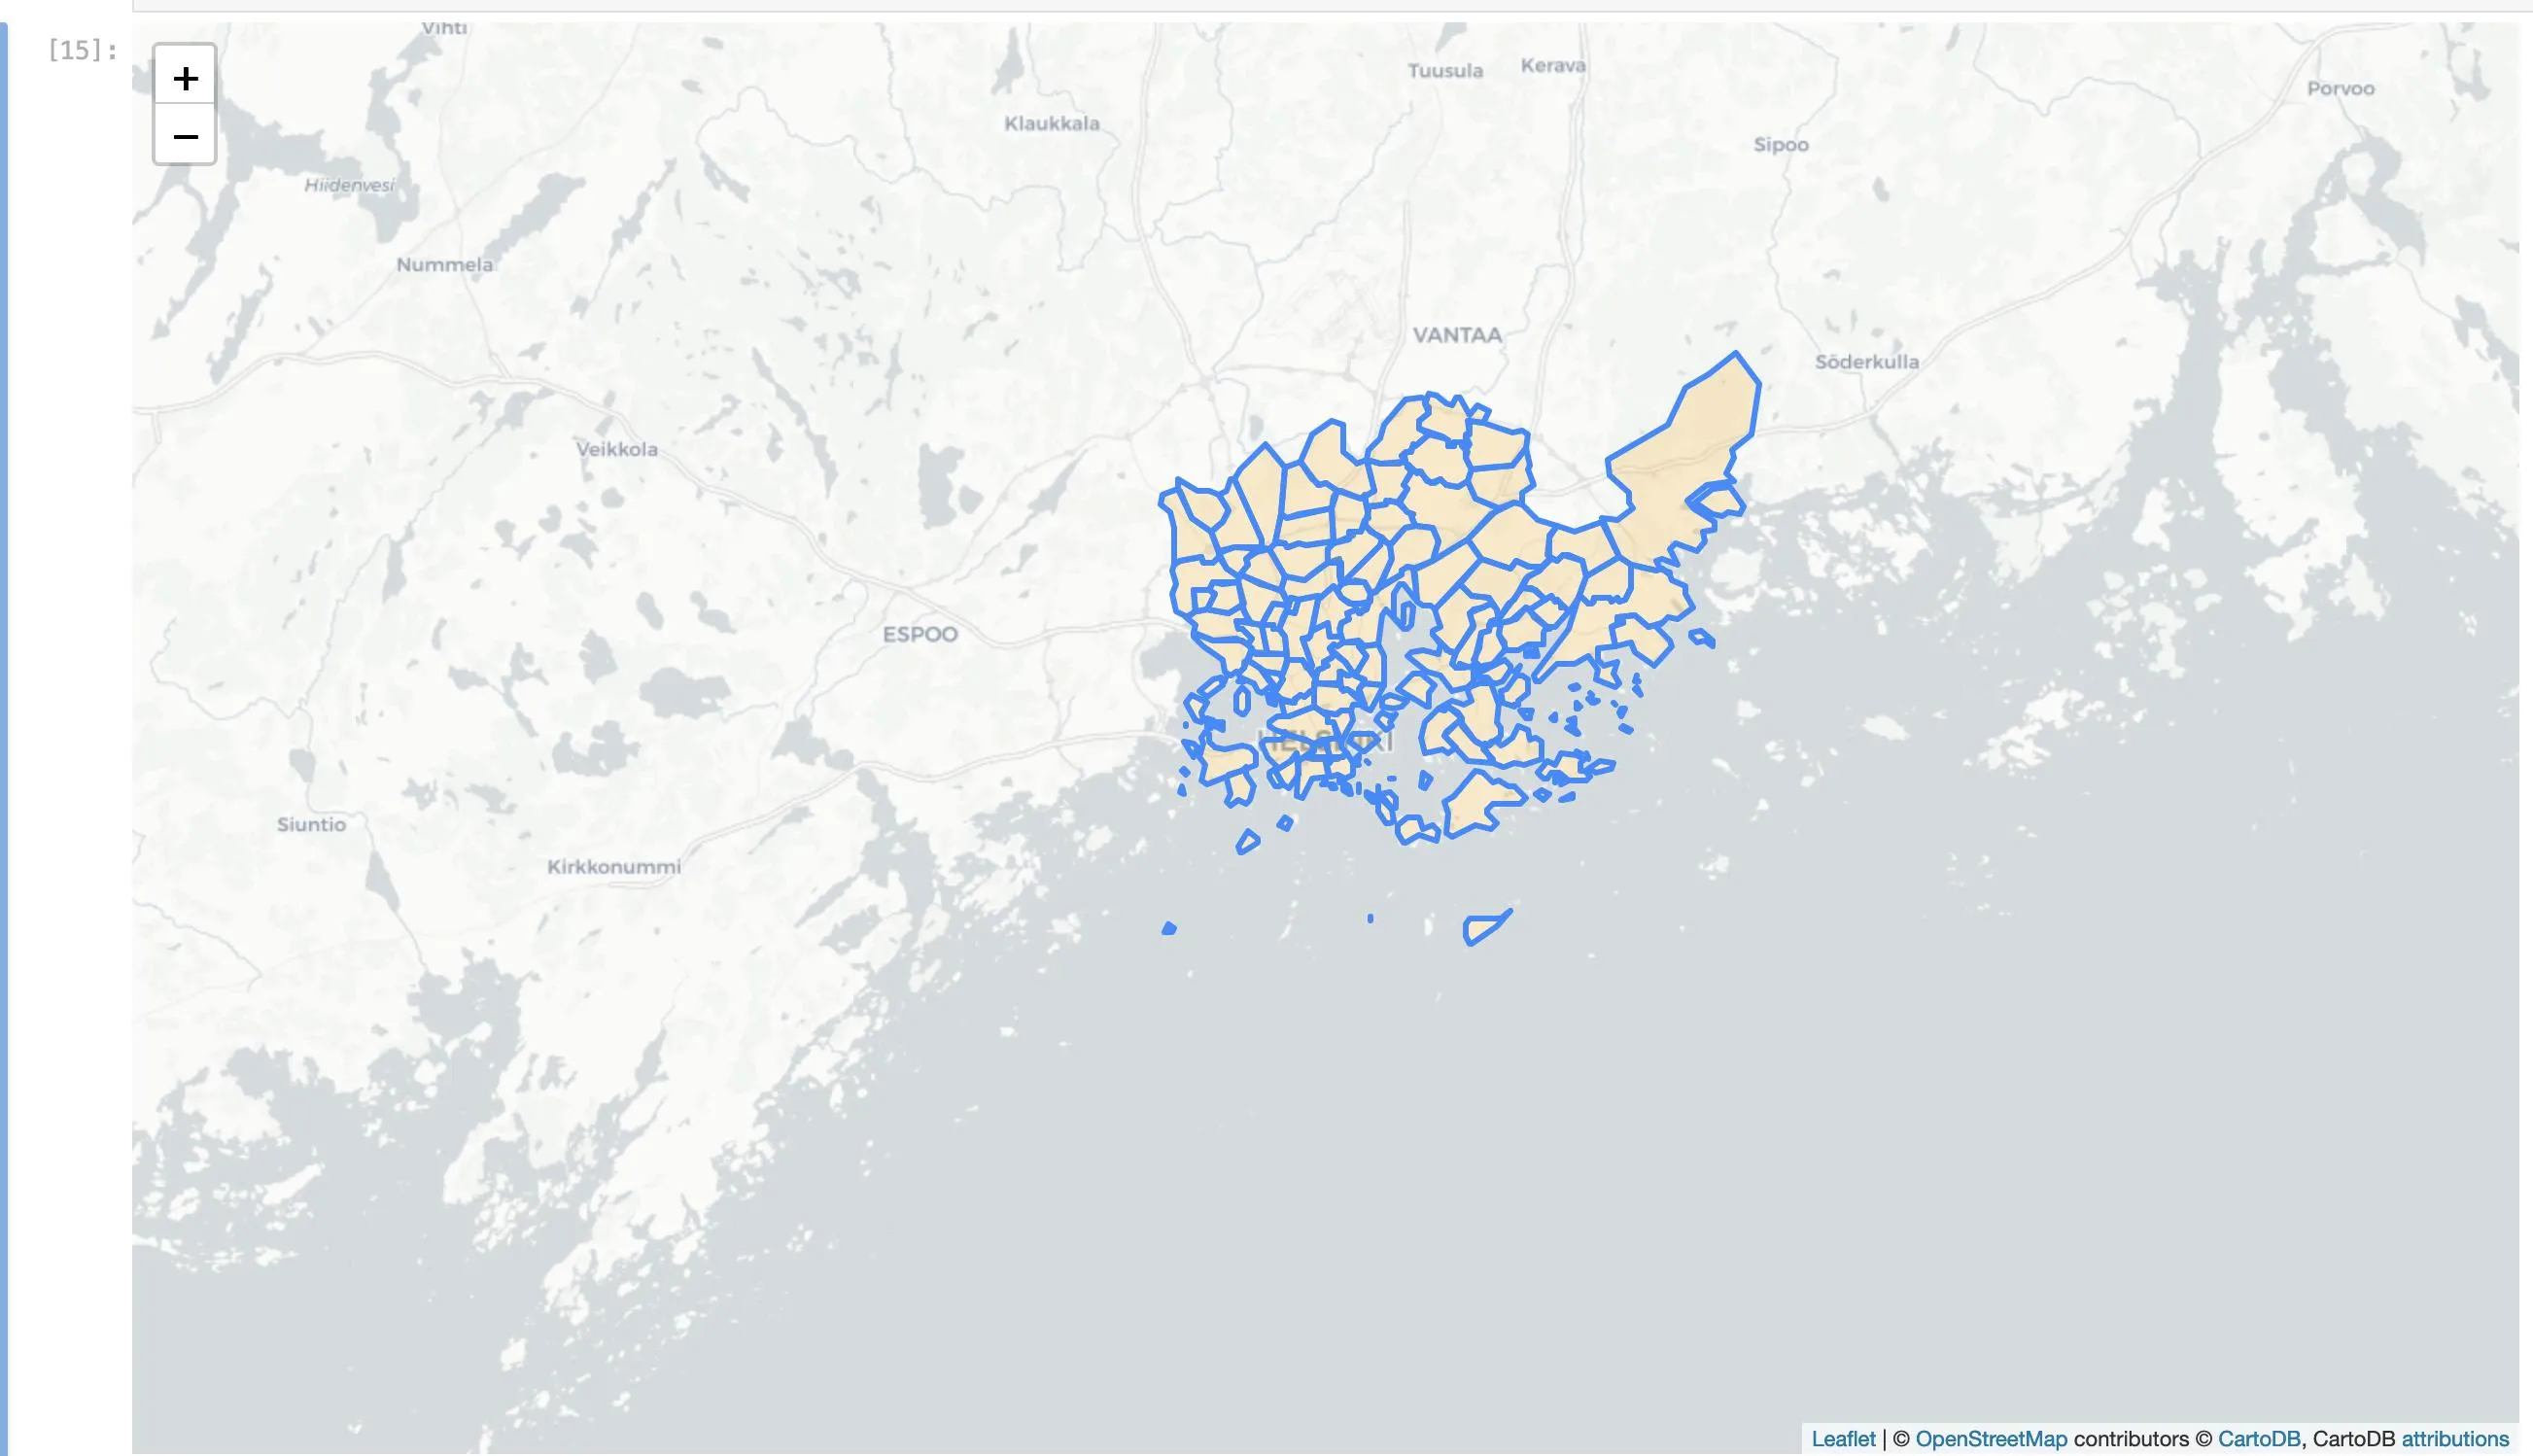
m = folium.Map(location=[60.1674881,24.9427473], zoom_start=10, tiles='CartoDB positron')
m
for _, r in df.iterrows():
# Without simplifying the representation of each borough,
# the map might not be displayed
sim_geo = gdp.GeoSeries(r['geometry']).simplify(tolerance=0.00001)
geo_j = sim_geo.to_json()
geo_j = folium.GeoJson(data=geo_j,
style_function=lambda x: {'fillColor': 'orange'})
folium.Popup(r['nimi']).add_to(geo_j)
geo_j.add_to(folium.Popup(r['nimi']))
m