在folium中使用geodataframe绘制带颜色的多边形

13

我正在尝试在folium中绘制雷达数据,离目标已经很接近了。我按照这个例子(Contour plot data (lat,lon,value) within boundaries and export GeoJSON)将我的数据转换为GeoJson格式。

nb_class = 20 
collec_poly = plt.contourf(lons,lats,np.array(poshdata), nb_class,alpha=0.5)

gdf = collec_to_gdf(collec_poly) # From link above
gdf.to_json()
colors = [p.get_facecolor().tolist()[0] for p in collec_poly.collections]
gdf['RGBA'] = colors

gdf

这将输出两列:几何图形和RGBA。

    RGBA    geometry
0   [0.0, 0.0, 0.713903743316, 1.0] (POLYGON ((-71.57032079644679 42.2775236331535...
1   [0.0, 0.0960784313725, 1.0, 1.0]    (POLYGON ((-71.56719970703125 42.2721176147460...
2   [0.0, 0.503921568627, 1.0, 1.0] (POLYGON ((-71.55678558349609 42.2721176147460...
3   [0.0, 0.896078431373, 0.970904490829, 1.0]  (POLYGON ((-71.52552795410156 42.2849182620049...
4   [0.325743200506, 1.0, 0.641998734978, 1.0]  (POLYGON ((-71.49427795410156 42.2939676156927...
5   [0.641998734978, 1.0, 0.325743200506, 1.0]  (POLYGON ((-71.47344207763672 42.3003084448852...
6   [0.970904490829, 0.959331880901, 0.0, 1.0]  (POLYGON ((-71.26508331298828 42.3200411822557...
7   [1.0, 0.581699346405, 0.0, 1.0] (POLYGON ((-71.15048217773438 42.3333218460720...

然后我制作我的folium地图:

import folium    

# Picked location between Sudbury and Somerville:
maploc = folium.Map(location=[42.377157,-71.236088],zoom_start=11,tiles="Stamen Toner")

folium.GeoJson(gdf).add_to(maploc)
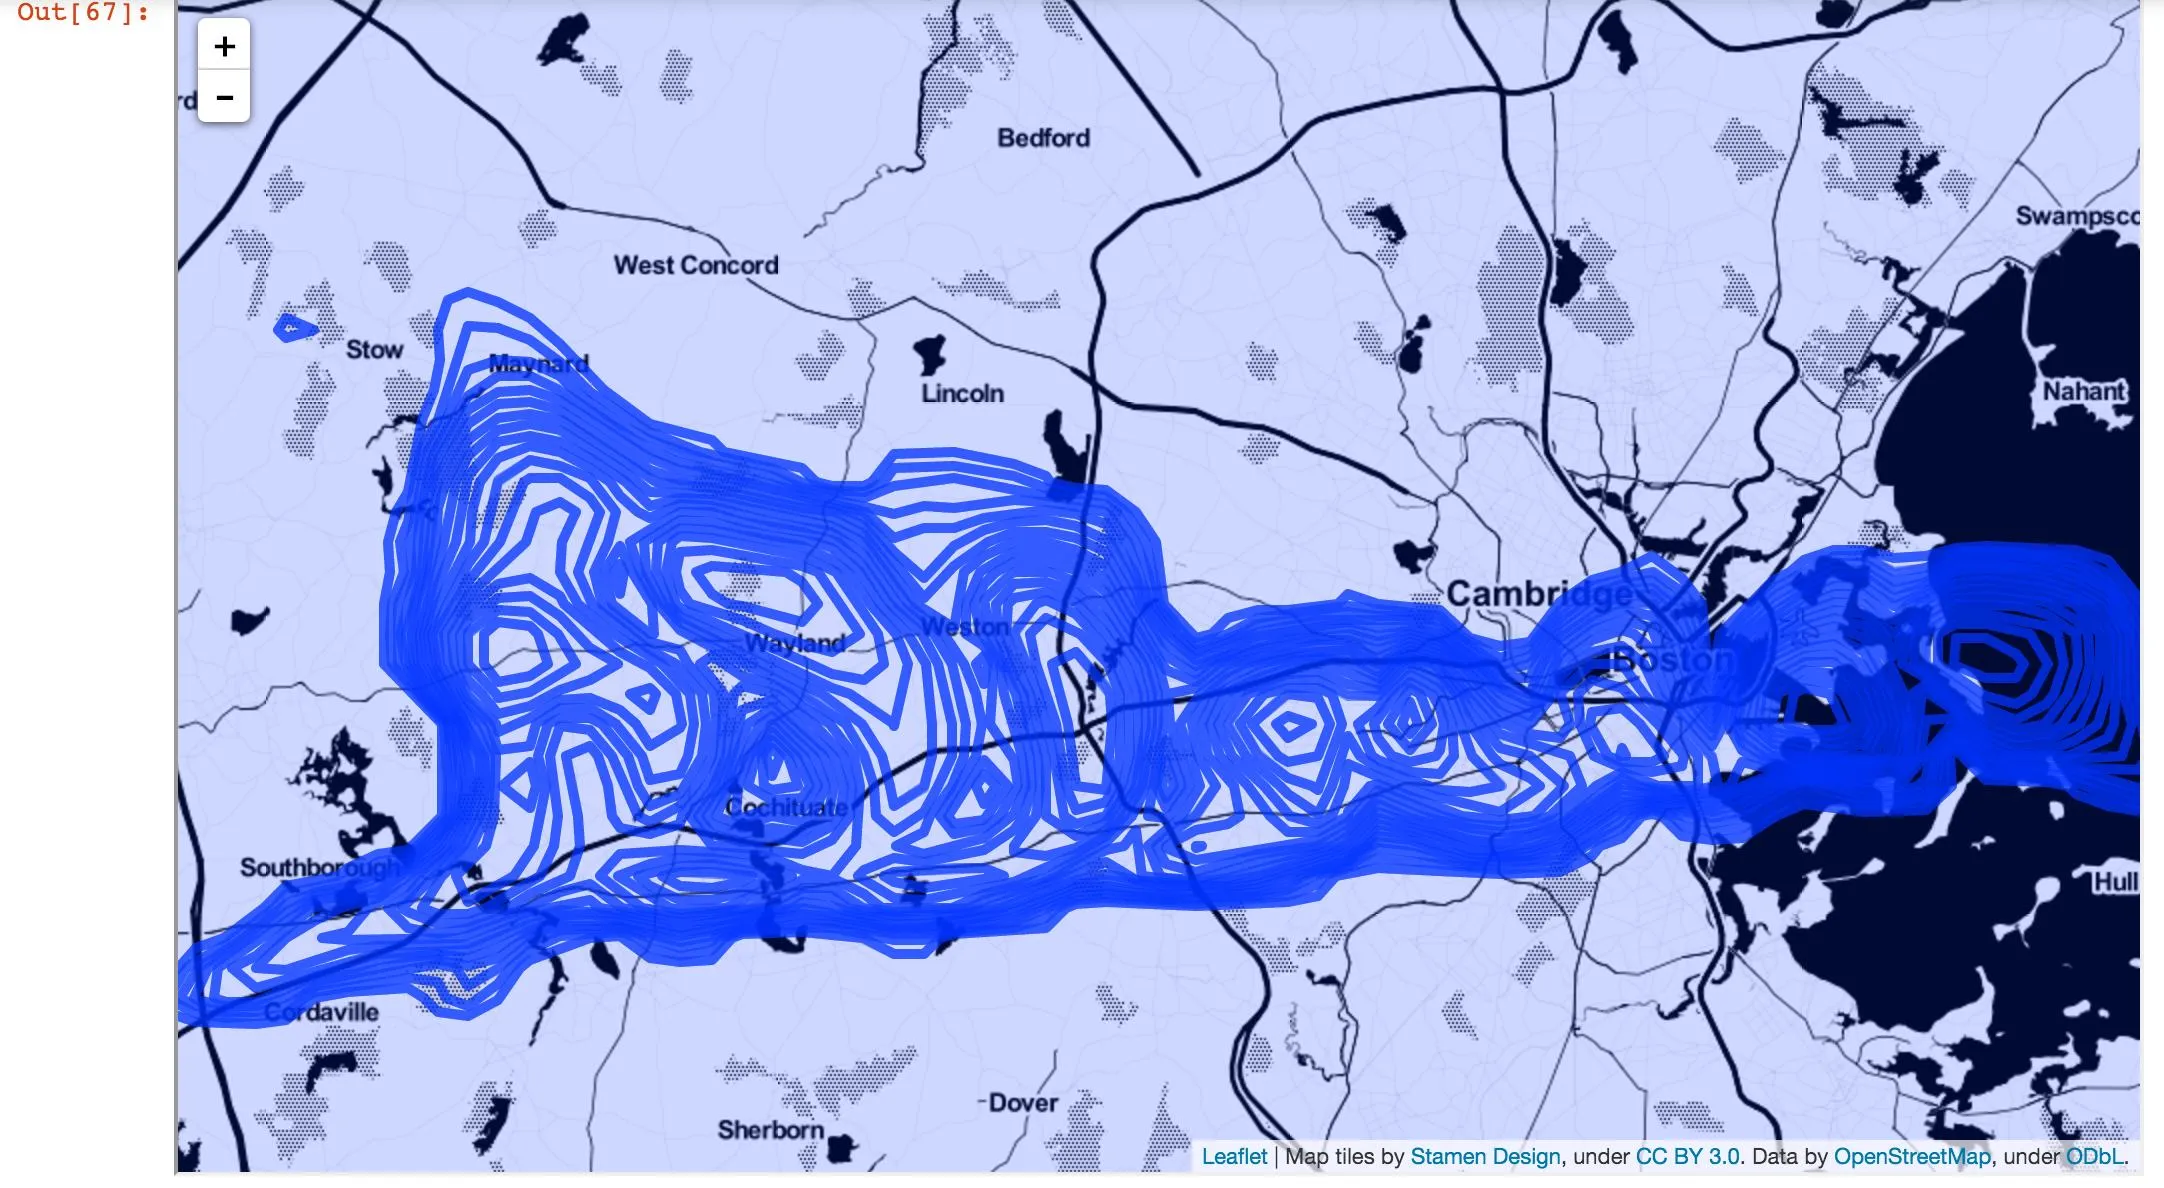
这创建了我的漂亮的folium地图,但是多边形没有被着色。如何用正确的颜色填充轮廓?并修复透明度?

输入图像描述


1
谢谢你的问题 - 它帮助我弄清楚如何在folium中绘制GeoDataFrame - Ufos
3个回答

14

我想我已经搞清楚了。在我的以前的代码中,polygon.get_facecolor() 返回一个RGBA值列表,该列表的范围在0-1之间。我添加了这个函数(修改自 这篇 帖子):

def convert_to_hex(rgba_color) :
    red = str(hex(int(rgba_color[0]*255)))[2:].capitalize()
    green = str(hex(int(rgba_color[1]*255)))[2:].capitalize()
    blue = str(hex(int(rgba_color[2]*255)))[2:].capitalize()

    if blue=='0':
        blue = '00'
    if red=='0':
        red = '00'
    if green=='0':
        green='00'

    return '#'+ red + green + blue

将其转换为十六进制字符串。然后:

gdf['RGBA'] = convert_to_hex(colors)

然后为了在folium中绘制颜色,我执行以下操作:

maploc = folium.Map(location=[42.377157,-71.236088],zoom_start=10,tiles="Stamen Toner")

colors = []
folium.GeoJson(
    gdf,
    style_function=lambda feature: {
        'fillColor': feature['properties']['RGBA'],
        'color' : feature['properties']['RGBA'],
        'weight' : 1,
        'fillOpacity' : 0.5,
        }
    ).add_to(maploc)

而且这还创建了一个非常漂亮的图!(属性名称有点误导人,它实际上并不是RGBA值,而是十六进制字符串。)


6

我不是专家... 我刚开始接触 folium 和 jupyter,遇到了类似的问题,但是是关于线条的。 你说你有 GeoJson 和多边形,颜色包含在 json 中,我猜测。

style_function 可以帮助你实现你想要的效果?

下面的示例是使用此页面生成的:http://geojson.io/ 我所做的就是使用 style_function 进行“映射”。 也可以使用自定义函数,参见: https://github.com/python-visualization/folium/blob/master/examples/Colormaps.ipynb

import folium
geoJsonData = {
    "features": [
        {
            "geometry": {
                "coordinates": [
                    [
                        12.98583984375,
                        56.70450561416937
                    ],
                    [
                        14.589843749999998,
                        57.604221411628735
                    ],
                    [
                        13.590087890625,
                        58.15331598640629
                    ],
                    [
                        11.953125,
                        57.955674494979526
                    ],
                    [
                        11.810302734375,
                        58.76250326278713
                    ]
                ],
                "type": "LineString"
            },
            "properties": {
                "stroke": "#fc1717",
                "stroke-opacity": 1,
                "stroke-width": 2
            },
            "type": "Feature"
        },
        {
            "geometry": {
                "coordinates": [
                    [
                        14.9468994140625,
                        57.7569377956732
                    ],
                    [
                        15.078735351562498,
                        58.06916140721414
                    ],
                    [
                        15.4302978515625,
                        58.09820267068277
                    ],
                    [
                        15.281982421875002,
                        58.318144965188246
                    ],
                    [
                        15.4852294921875,
                        58.36427519285588
                    ]
                ],
                "type": "LineString"
            },
            "properties": {
                "stroke": "#1f1a95",
                "stroke-opacity": 1,
                "stroke-width": 2
            },
            "type": "Feature"
        }
    ],
    "type": "FeatureCollection"
}
m = folium.Map(location=[ 56.7, 12.9], zoom_start=6)
folium.GeoJson(geoJsonData,
    style_function=lambda x: {
        'color' : x['properties']['stroke'],
        'weight' : x['properties']['stroke-width'],
        'opacity': 0.6,
        'fillColor' : x['properties']['fill'],
        }).add_to(m)
m

在 GitHub 上的 folium 源代码中也包含了一些不错的示例:
https://github.com/python-visualization/folium/tree/master/examples
您可以在这里找到需要使用的选项:
http://leafletjs.com/reference.html#path-options

希望这能对您有所帮助!


1

我还没有足够的声望点来进行评论,所以这是一个单独的答案,旨在澄清edub所写的被接受的答案。

Matplotlib已经有了colors.to_hex()方法:

import matplotlib.colors as cl

colors = [cl.to_hex(c) for c in colors]

这将替换已接受答案中的convert_to_hex()方法。

1
请注意,即使您的声望还不足以发表评论,您仍然可以编辑其他用户的帖子以包含必要的澄清信息。 - Hoppeduppeanut
我知道你不是制定这个政策的人,但在我还不能评论他们的回答时编辑别人的回答似乎有些不合适。我不明白为什么事情要按照这种顺序进行。 - lead
我知道这有点傻,但这是为了防止不必要的或对话式的评论(如添加“+1”或“谢谢!!!”的评论)和垃圾邮件,以及新用户的编辑在发布之前由社区进行同行评审,因此有一个保护层,评论没有。一旦您获得5个声望,您可以与更广泛的社区在Meta Stack Overflow上讨论此问题,您可以通过几个批准的编辑或一个赞同的问题/答案来获得5个声望。 - Hoppeduppeanut
我的意思是,我已经使用StackOverflow超过2年了,每天多次使用。在我参与的其他社区中,我有10多个声望点,但很少参与。这说明了一件事,即我还没有获得5个声望点,无法评论如何在这个特定网站上获得声望点。 - lead

网页内容由stack overflow 提供, 点击上面的
可以查看英文原文,
原文链接