使用“explore”方法绘制GeoDataFrame时,基于列颜色的设置。

3
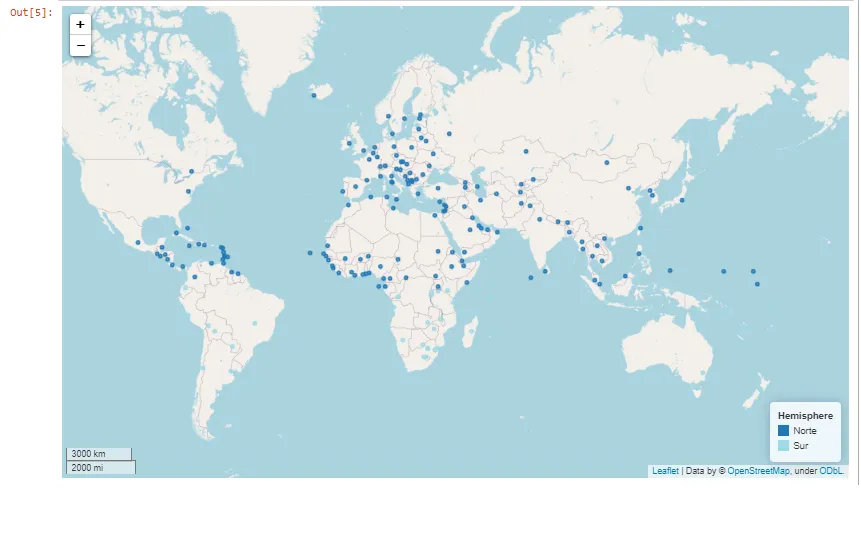
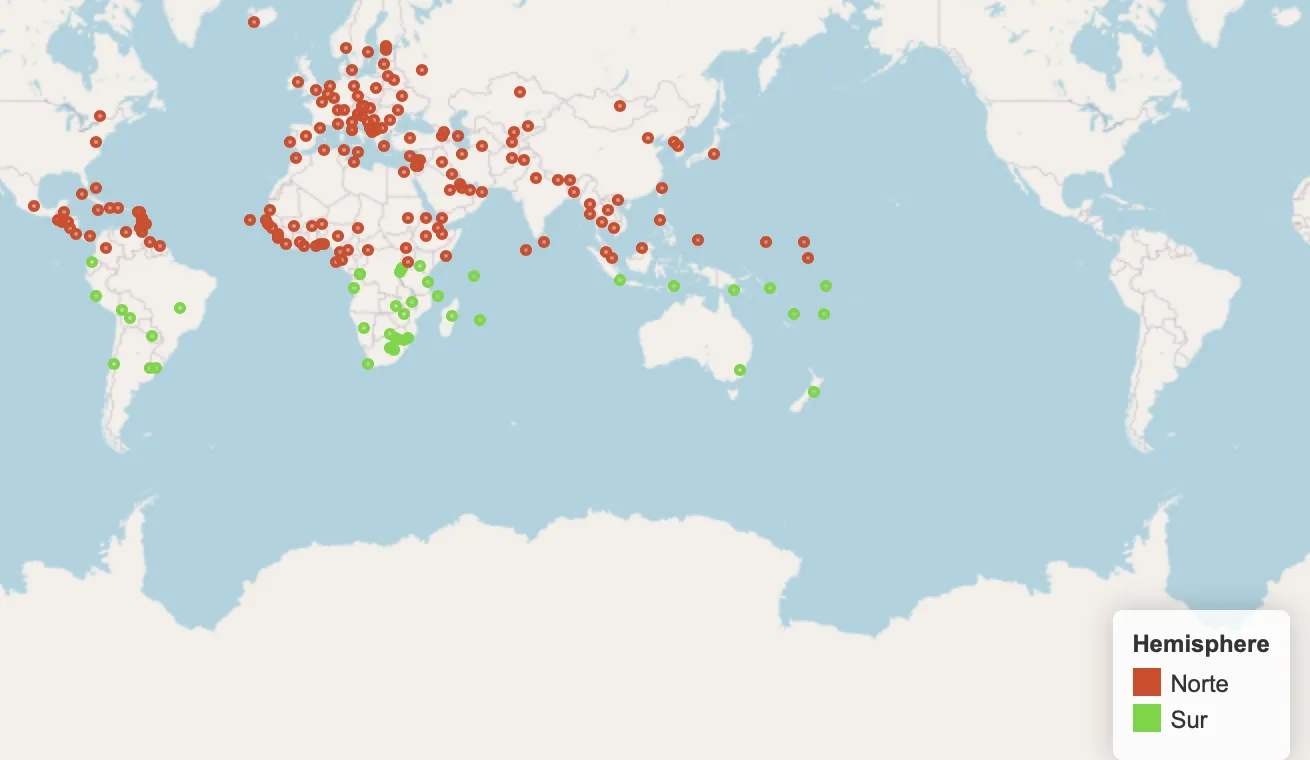
我想要用“颜色”列指定的颜色来为属于某个半球的城市着色。每个半球(每个类别)的所有城市在该列中具有相同的值。我希望图例也显示相同的颜色。
我无法做到这一点。有人可以帮帮我吗?非常感谢您的帮助。
注意:这是一个可重现的示例,基于geopandas示例。
import geopandas as gpd

gdf = gpd.read_file(gpd.datasets.get_path('naturalearth_cities'))
gdf['Hemisphere'] = gdf['geometry'].apply(lambda x: 'Norte'if x.y > 0 else 'Sur')
gdf['Color'] = gdf['Hemisphere'].apply(lambda x: '#D94325' if x=='Norte' else '#5CD925')

gdf.explore(column='Hemisferio', color='Color')

enter image description here

1个回答

2
import geopandas as gpd
import matplotlib.colors as colors

gdf = gpd.read_file(gpd.datasets.get_path('naturalearth_cities'))
gdf['Hemisphere'] = gdf['geometry'].apply(lambda x: 'Norte'if x.y > 0 else 'Sur')
gdf.explore(column='Hemisphere', cmap=colors.ListedColormap(['#D94325','#5CD925']))

enter image description here


太好了!非常感谢!由于它与“plot”方法的工作方式相同,这也回答了这个问题:https://gis.stackexchange.com/q/417574/194341 我邀请您也来回答 :) - Miguel Gonzalez
已注册并回答... - Rob Raymond

网页内容由stack overflow 提供, 点击上面的
可以查看英文原文,
原文链接