我在R中计算了二项式回归:
Call:
glm(formula = cbind(success, failure) ~ x * f, family = "binomial",
    data = tb1)

Deviance Residuals:
    Min       1Q   Median       3Q      Max
-3.6195  -0.9399  -0.0493   0.5698   2.0677

Coefficients:
              Estimate Std. Error z value Pr(>|z|)
(Intercept) -2.3170182  0.0622600 -37.215  < 2e-16 ***
x            0.0138201  0.0009892  13.972  < 2e-16 ***
fTRUE        0.6466238  0.1976115   3.272  0.00107 **
x:fTRUE     -0.0035741  0.0032587  -1.097  0.27273
---
Signif. codes:  0 ‘***’ 0.001 ‘**’ 0.01 ‘*’ 0.05 ‘.’ 0.1 ‘ ’ 1

(Dispersion parameter for binomial family taken to be 1)

    Null deviance: 479.88  on 147  degrees of freedom
Residual deviance: 201.53  on 144  degrees of freedom
  (7 observations deleted due to missingness)
AIC: 870.72

Number of Fisher Scoring iterations: 4
我希望能够将其可视化,即绘制数据和回归曲线。我可以轻松地使用线性平滑器:
ggplot(tb1, aes(x, success/(success+failure), colour=f)) +
  geom_point() +
  geom_smooth(method="lm")

但我真正想要的是通过数据绘制一个逻辑曲线。当我尝试时:
ggplot(tb1, aes(x, success/(success+failure), colour=f)) +
  geom_point() +
  geom_smooth(
    method="glm",
    method.args=list(family="binomial"),
  )
我得到了这张图表:
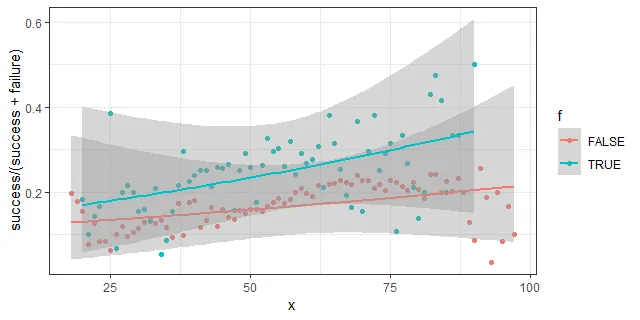
看起来不太对。标准误差不应该那么大。我认为我需要在geom_smooth中明确指定公式,但是我无法正确地使用语法。当我尝试时:
ggplot(tb1, aes(x, success/(success+failure), colour=f)) +
  geom_point() +
  geom_smooth(
    method="glm",
    method.args=list(
      family="binomial",
      formula = cbind(success, failure) ~ x
    )
  )
我收到了以下信息:
警告信息:
在stat_smooth()中计算失败:
找不到对象“success”
我该如何正确指定公式?
