使用ggplot2更改条形图内部条的颜色

3
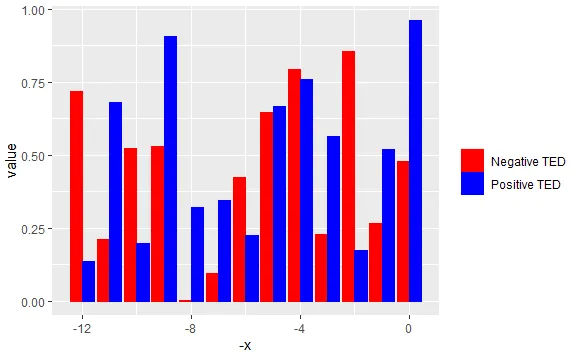
我有以下的柱状图,但我只能改变边框的颜色。无论我尝试什么,都不能改变柱状图内部的颜色,它仍然是灰色的。
pteddf=data.frame(x=c(0:12),runif(13),runif(13))
tidyr::pivot_longer(pteddf, -x)

colors=c("red", "blue")

ggplot(tidyr::pivot_longer(pteddf, -x),aes(-x,value,color=name,group=name))+
  geom_bar(stat="identity",position=position_dodge())+
  scale_color_manual(name="",labels = c("Negative TED","Positive TED"),
                     values= colors)+
  scale_fill_manual( values = colors)

1
这个回答解决了你的问题吗?如何在R中使用ggplot2更改geom_bar中的条形图颜色 - holzben
1个回答

2
尝试这个。您可以在 aes() 部分中使用 fill 来更改填充颜色:
pteddf=data.frame(x=c(0:12),runif(13),runif(13))
tidyr::pivot_longer(pteddf, -x)

colors=c("red", "blue")

ggplot(tidyr::pivot_longer(pteddf, -x),aes(-x,value,
                                           fill=name,
                                           color=name,group=name))+
  geom_bar(stat="identity",position=position_dodge())+
  scale_color_manual(name="",labels = c("Negative TED","Positive TED"),
                     values= colors)+
  scale_fill_manual(name="",values = colors,
                     labels = c("Negative TED","Positive TED"))

输出:

在此输入图片描述


(注:该内容为HTML代码,无法翻译解释)

网页内容由stack overflow 提供, 点击上面的
可以查看英文原文,
原文链接