有没有一种简单的方法来增加matplotlib颜色循环,而不必深入探究轴的内部?
在交互式绘图中,我经常使用的一个常见模式是:
import matplotlib.pyplot as plt
plt.figure()
plt.plot(x,y1)
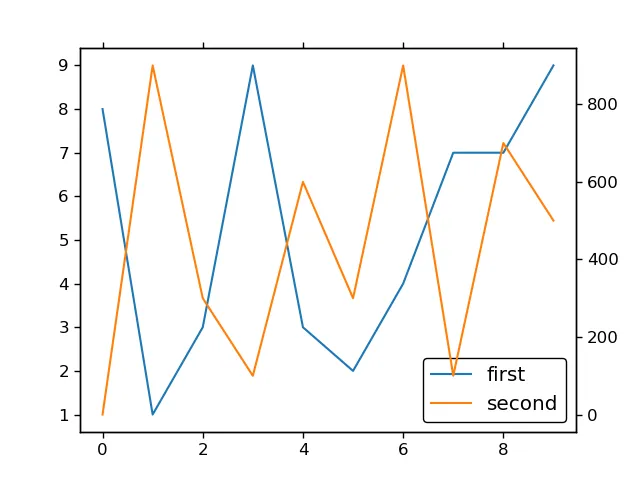
plt.twinx()
plt.plot(x,y2)
使用 plt.twinx() 方法可以使 y1 和 y2 有不同的 y 轴刻度,但两个图都会使用默认颜色循环中的第一个颜色绘制,因此需要为每个图手动声明颜色。
必须有一种简洁的方法来指示第二个图增加颜色循环,而不是明确给出颜色。当然,对于两个图都设置 color='b' 或 color='r' 非常容易,但如果使用自定义样式(如 ggplot),则需要从当前颜色循环中查找颜色代码,这对交互使用来说很麻烦。