我有这些数据,并试图使用ggplot2和scales来格式化x轴,包括日期和时间。
dput(head(pp))
structure(list(DateTime = structure(c(1362405600, 1362409200,
1362412800, 1362416400, 1363006800, 1363010400), class = c("POSIXct",
"POSIXt"), tzone = ""), Day = structure(c(1L, 1L, 1L, 1L, 1L,
1L), .Label = c("Fri", "Mon", "Sat", "Sun", "Thu", "Tue", "Wed"
), class = "factor"), Total_Logins = c(818832L, 801771L, 787508L,
731672L, 748872L, 727140L), Unique_Logins = c(732152L, 713380L,
701348L, 647321L, 672848L, 649453L), Date = structure(c(15768,
15768, 15768, 15768, 15775, 15775), class = "Date")), .Names = c("DateTime",
"Day", "Total_Logins", "Unique_Logins", "Date"), row.names = c(1498L,
1499L, 1500L, 1501L, 1666L, 1667L), class = "data.frame")
library(ggplot2)
library(scales)
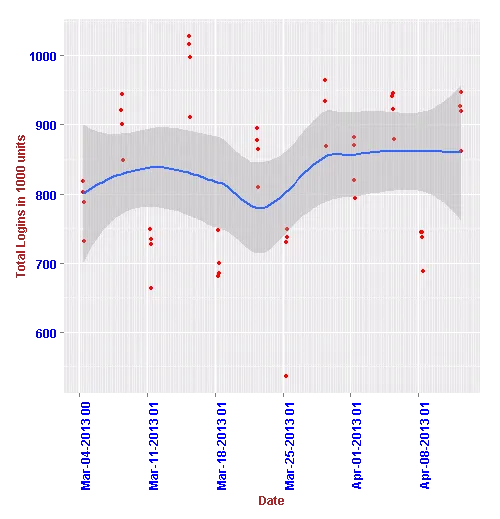
ggplot(subset(pp, Day=="Fri"), aes(DateTime, Total_Logins, group=1)) +
geom_line() +
geom_smooth(method="loess", se=T, size=1) +
scale_x_date(breaks = "1 day", labels=date_format("%b-%d-%Y %H"))
我遇到了这个错误:
错误:无效输入:date_trans仅适用于Date类的对象
我的DateTime列已经格式化为Date。你有什么想法,我在这里做错了什么吗?