我正在努力使用ggplot2格式化堆积面积图的x轴。这是我的数据:
df <- data.frame(
     Taxon = c("Others", "Dinos", "Diatoms", "Others", "Dinos", "Diatoms", "Others", "Dinos", "Diatoms", "Others", "Dinos", "Diatoms", "Others", "Dinos", "Diatoms", "Others", "Dinos", "Diatoms", "Others", "Dinos", "Diatoms", "Others", "Dinos", "Diatoms"),
     Abundance = c(14192, 120, 440, 6000, 80, 360, 25800, 4384, 169428, 879103, 2000, 52360, 213508, 22560, 470900, 472808, 11920, 316312, 81504, 6280, 15096, 50656, 11360, 43448),
     Date = c("05/01/2019", "05/01/2019", "05/01/2019", "09/03/2019", "09/03/2019", "09/03/2019", "11/04/2019", "11/04/2019", "11/04/2019", "01/05/2019", "01/05/2019", "01/05/2019", "01/06/2019", "01/06/2019", "01/06/2019", "01/07/2019", "01/07/2019", "01/07/2019", "01/08/2019", "01/08/2019", "01/08/2019", "01/09/2019","01/09/2019", "01/09/2019")
)

df %>% group_by(Date, Taxon) %>% summarise_all(sum) -> df1

ggplot(df1, aes(x=as.Date(Date, format="%d/%m/%Y"), Abundance, colour=Taxon, fill=Taxon)) + geom_area(stat="identity", position="stack") + labs(x = "", y = "") + scale_x_date(labels = date_format("%d/%m/%Y")) + theme(axis.text.x = element_text(angle = 45, vjust = 0.5))
这给我展示了以下的图表:
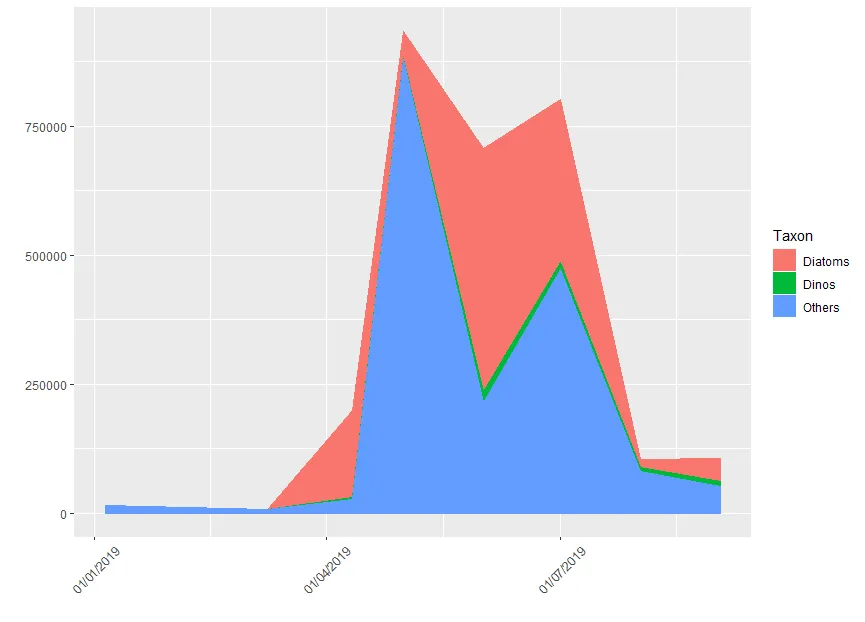
我的问题如下:
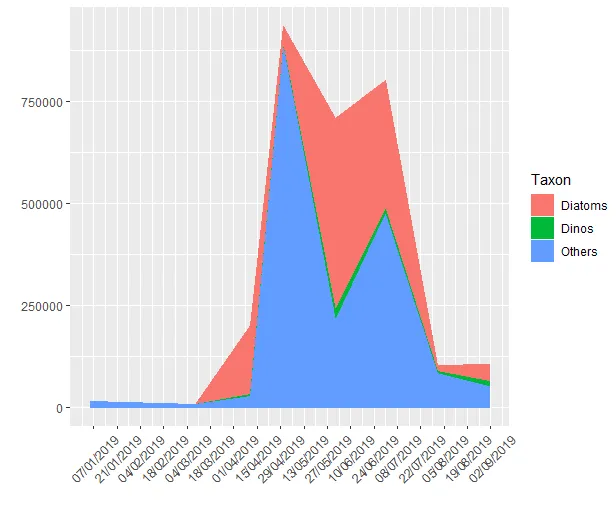
- 如何使x轴标签对应df2$Date中的日期而不是每个月的第一天?
- 我希望所有日期都在x轴上可见。我尝试使用
scale_x_continuous(labels=dates)和dates <- unique(df1$Date),但这给我一个错误。如何解决它?
非常感谢任何提示!
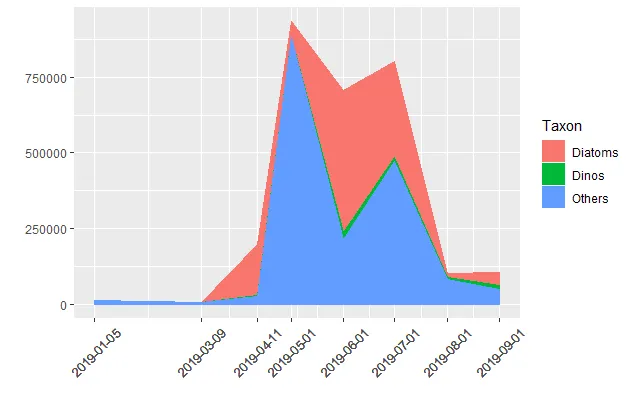
date_breaks参数,而不是date_labels参数。 - camille