我在绘制图表时,非常非常难以让x轴看起来正确。
这是我的数据:
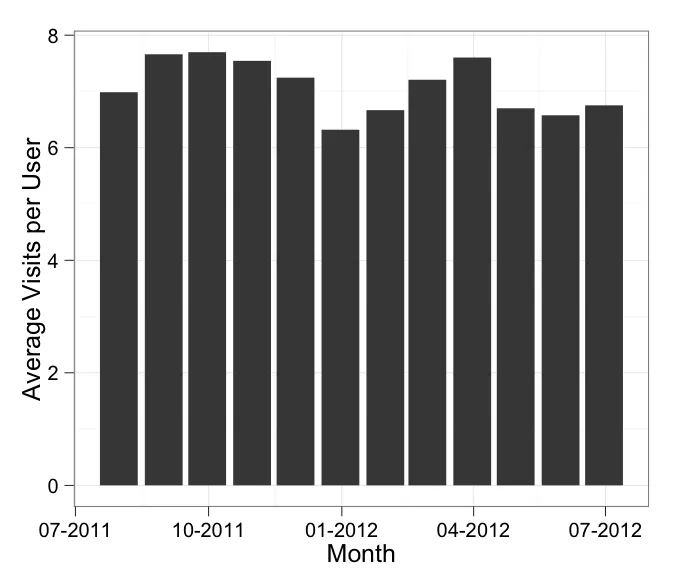
df <- data.frame(
  Month = factor(c(
    "2011-07-31", "2011-08-31", "2011-09-30", "2011-10-31", "2011-11-30",
    "2011-12-31", "2012-01-31", "2012-02-29", "2012-03-31", "2012-04-30",
    "2012-05-31", "2012-06-30"
  )),
  AvgVisits = c(
    6.98655104580674, 7.66045407330464, 7.69761337479304, 7.54387561322994,
    7.24483848458728, 6.32001400498928, 6.66794871794872, 7.207780853854,
    7.60281201431308, 6.70113837397123, 6.57634103019538, 6.75321935568936
  )
)
这是我正在尝试绘制的图表:
ggplot(df, aes(x = Month, y = AvgVisits)) +
  geom_bar() +
  theme_bw() +
  labs(x = "Month", y = "Average Visits per User")
那个图表运行良好 - 但是,如果我想要调整日期的格式,我认为应该添加以下内容:
scale_x_date(labels = date_format("%m-%Y"))
我正在尝试使日期标签为'MMM-YYYY'
ggplot(df, aes(x = Month, y = AvgVisits)) +
  geom_bar() +
  theme_bw() +
  labs(x = "Month", y = "Average Visits per User") +
  scale_x_date(labels = date_format("%m-%Y"))
当我绘制时,我持续收到这个错误:
stat_bin: binwidth默认为range/30。使用'binwidth = x'来调整。
尽管在格式化geom_line和geom_bar方面进行了数小时的研究,但我无法解决它。有人能解释一下我做错了什么吗?
编辑:作为后续想法:你可以将日期用作因子,还是应该在日期列上使用as.Date?
library(scales)库? - smilligscales已经加载。 - mikebmassey